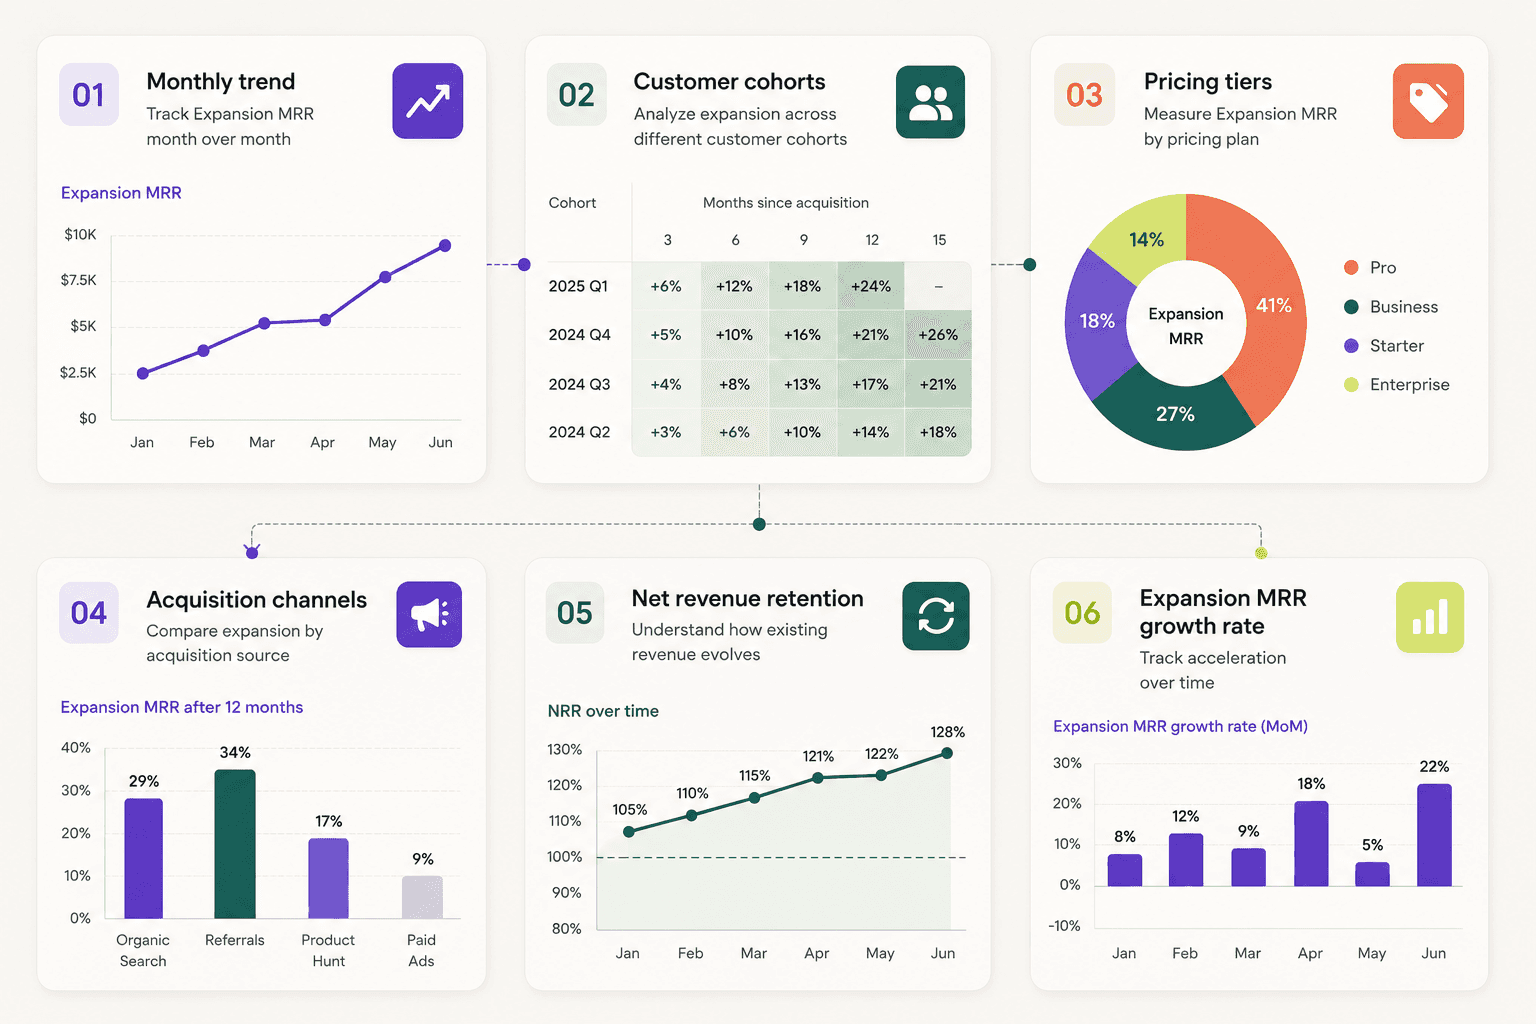
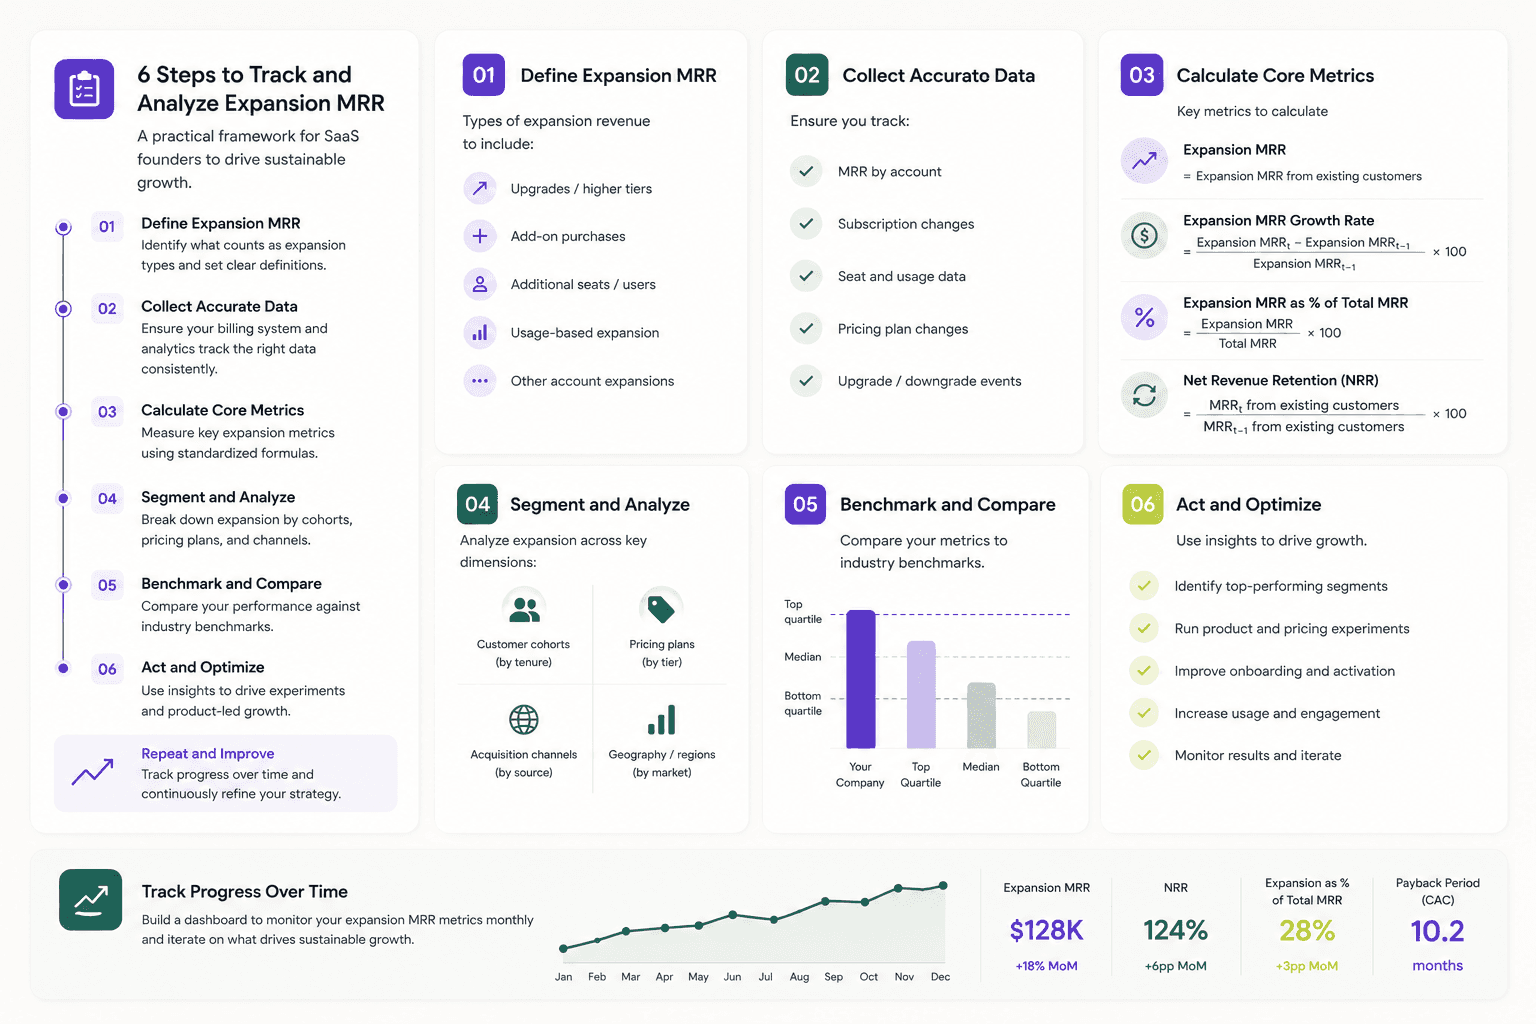
SaaS founders typically track Expansion MRR growth by monitoring monthly Expansion MRR, net revenue retention (NRR), customer cohorts, pricing tiers, and expansion by acquisition channel. Most also use subscription analytics tools like ChartMogul, Baremetrics, or Stripe dashboards to measure recurring revenue generated from existing customers.
These metrics help founders understand whether revenue growth comes from upsells, additional seats, add-ons, or increased product usage. Instead of looking only at total Monthly Recurring Revenue (MRR), they separate Expansion MRR from New MRR, Reactivation MRR, contraction, and churn to identify the real drivers of growth.
In this guide, you'll learn how SaaS founders track Expansion MRR growth, which SaaS metrics matter most, how to calculate Expansion MRR accurately, and which dashboards are commonly used to monitor recurring subscription revenue.
What is Expansion MRR?
Expansion MRR is the additional Monthly Recurring Revenue generated from existing customers. Unlike New MRR, which comes from newly acquired customers, Expansion MRR measures revenue generated after a customer has already subscribed.
This additional recurring revenue can come from several sources, including upgrading to a higher pricing tier, purchasing add-on revenue, expanding usage, or adding more seats to an existing account. Because it comes from customers who already know the product, Expansion MRR is often less expensive to generate than revenue from acquiring new customers.
A growing Expansion MRR is also a strong indicator of product-market fit. When customers voluntarily increase their spending over time, it usually means the product continues to deliver more value as their business grows.
Expansion MRR definition
A simple definition is:
Expansion MRR is the increase in Monthly Recurring Revenue generated from existing customers through upgrades, expansions, or additional recurring purchases.
Unlike one-time purchases or professional services, Expansion MRR includes only recurring subscription revenue expected to continue in future billing periods.
For example:
Customer action
Counts as Expansion MRR?
Upgrade from Pro to Business plan
✅
Purchase additional user seats
✅
Add a paid feature or module
✅
Increase usage in a usage-based pricing model
✅
One-time onboarding fee
❌
Consulting services
❌
Components of Expansion MRR
Expansion MRR can be generated in several ways depending on the SaaS business model.
The most common MRR components include:
Upselling customers to higher pricing tiers
Selling additional product modules or premium features
Increasing the number of licensed users or seats
Higher usage in consumption-based pricing
Selling recurring add-ons that increase monthly subscription revenue
For example, imagine a customer initially pays $100 per month. Three months later, they upgrade to a larger plan costing $150 per month.
Metric
Value
Starting MRR
$100
New monthly subscription
$150
Expansion MRR
+$50
Only the additional $50 counts as Expansion MRR because it represents new recurring revenue from an existing customer.
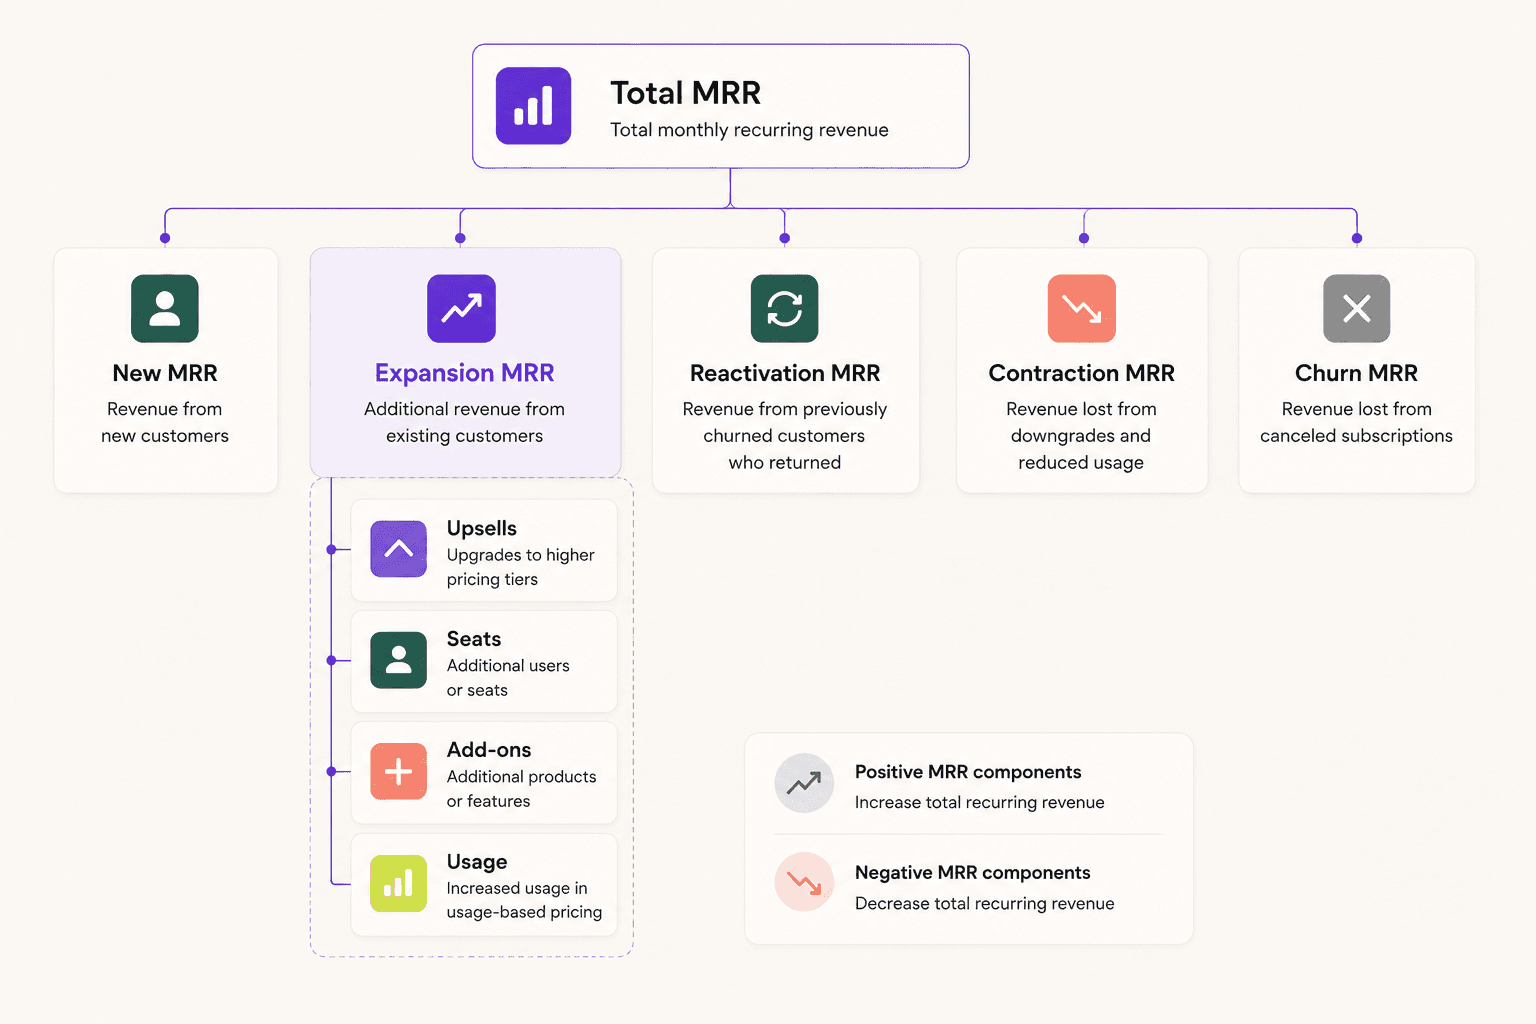
Expansion MRR vs new MRR vs reactivation MRR
One of the most common mistakes is combining different MRR metrics into a single number. Each represents a different type of revenue growth.
Metric
Source
New MRR
Revenue from new customers
Expansion MRR
Additional recurring revenue from existing customers
Reactivation MRR
Revenue from previously churned customers who returned
Separating these metrics gives founders a much clearer picture of what's driving growth.
For example, a SaaS business could report $30,000 in MRR growth during a month, but that growth might come from very different sources:
$15,000 from new customers
$10,000 from Expansion MRR
$5,000 from Reactivation MRR
Each source tells a different story about the business. New MRR reflects sales performance, Expansion MRR reflects customer success and product value, while Reactivation MRR shows the ability to win back previously lost customers.
Why Expansion MRR matters for SaaS revenue growth
Most early-stage SaaS companies rely heavily on acquiring new customers. As they mature, however, sustainable revenue growth increasingly comes from helping existing customers become more successful.
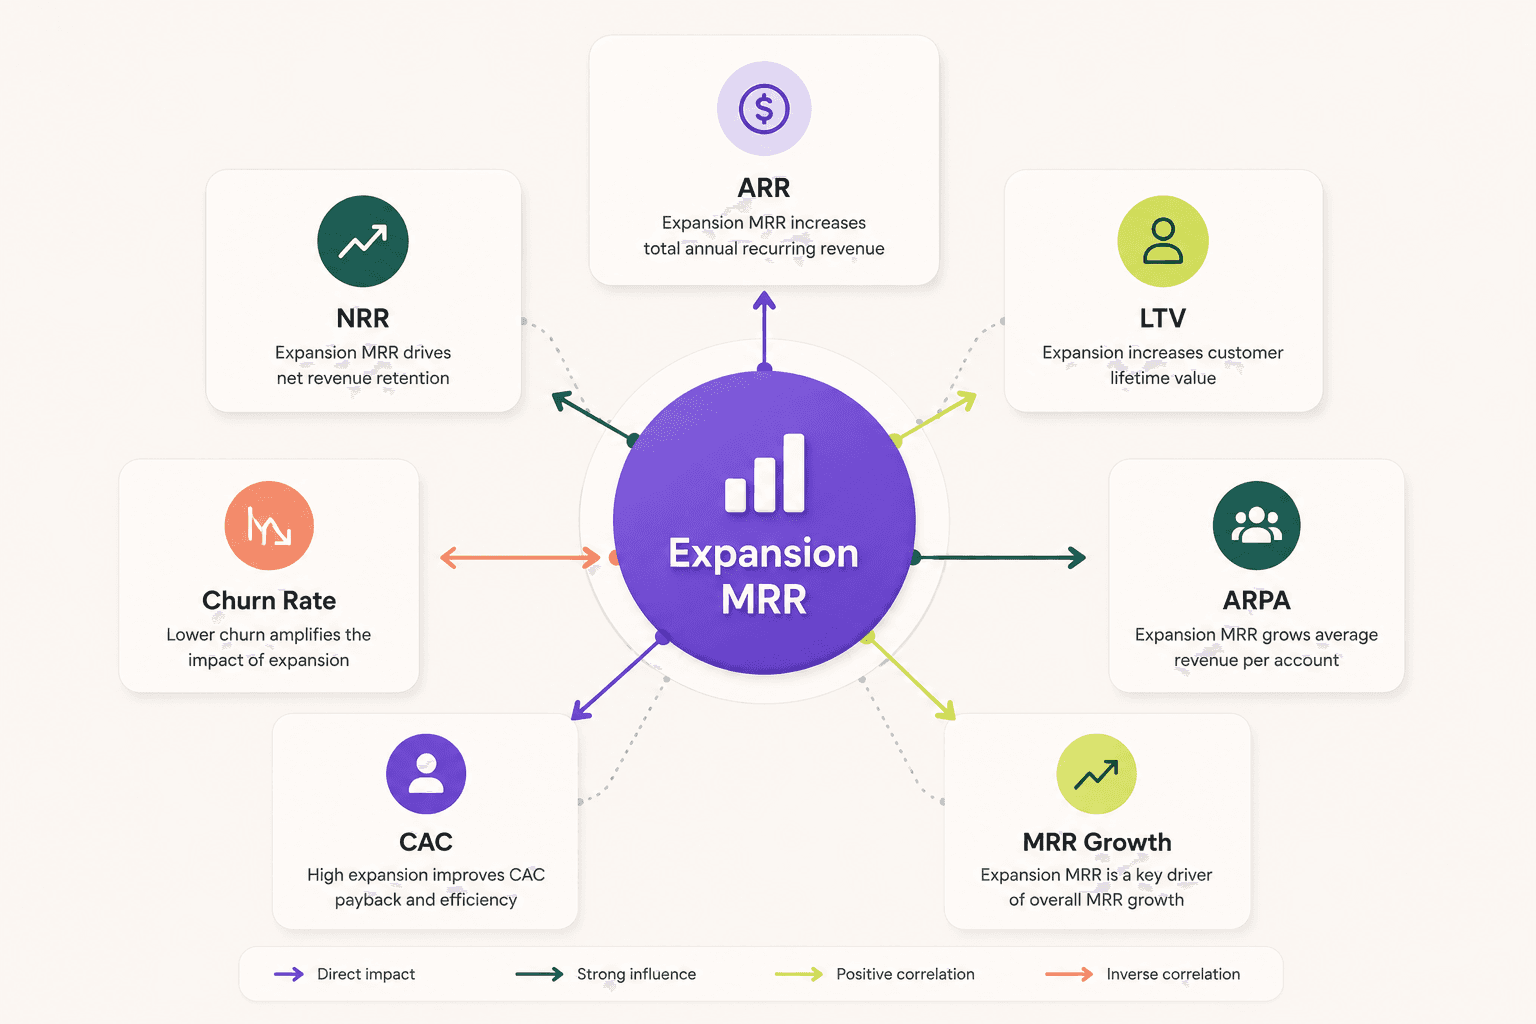
That's one reason why investors closely examine Expansion MRR alongside other SaaS metrics such as net revenue retention (NRR), annual recurring revenue (ARR), customer lifetime value (LTV), and churn. A company that consistently expands revenue within its existing customer base is generally viewed as having a stronger product and a more resilient business model.
Why investors pay attention to Expansion MRR
Expansion MRR demonstrates that customers are willing to spend more after adopting the product. This reduces dependence on constant customer acquisition and can improve long-term profitability.
Businesses with healthy Expansion MRR often benefit from:
higher customer lifetime value (LTV);
lower customer acquisition pressure;
stronger cash flow predictability;
higher net revenue retention;
more efficient long-term growth.
In many mature SaaS companies, expansion revenue becomes one of the largest contributors to overall SaaS revenue growth.
How Expansion MRR affects net revenue retention (NRR)
Net revenue retention measures how revenue from an existing customer base changes over time after accounting for Expansion MRR, contraction, downgrade, and churn.
If Expansion MRR exceeds revenue lost from contractions and churn, NRR can exceed 100%. This means the company is generating more recurring revenue from its existing customers even without acquiring new customers.
Because of this relationship, founders rarely analyze Expansion MRR in isolation. Instead, they evaluate it together with NRR to understand whether customer expansion is offsetting losses elsewhere in the business.
Why Expansion MRR matters for SaaS companies
Expansion MRR becomes increasingly important as a SaaS business grows. Winning every new customer becomes harder over time, but helping satisfied customers adopt more of the product often requires significantly less effort.
For many SaaS companies, the healthiest growth model combines both acquisition and expansion. New customers increase the customer base, while Expansion MRR increases the average revenue generated from each account. Together, these two engines create more predictable and durable recurring revenue growth.
How to track Expansion MRR growth
Tracking Expansion MRR isn't just about knowing how much additional revenue existing customers generate. The real value comes from understanding where that growth originates, which customer segments contribute the most, and whether expansion is accelerating or slowing over time.
Most SaaS founders review Expansion MRR every month alongside other SaaS KPIs such as MRR growth, churn rate, customer acquisition, and net revenue retention. Looking at these metrics together provides a much more complete picture than monitoring Expansion MRR alone.
Tracking MRR by month
The simplest approach is to measure Expansion MRR every month. Monthly reporting makes it easier to identify trends, evaluate pricing changes, and measure the impact of product improvements.
A typical dashboard might include:
Month
Expansion MRR
Month-over-month growth
January
$4,800
—
February
$5,600
+16.7%
March
$6,100
+8.9%
April
$7,200
+18.0%
Tracking MRR this way allows founders to spot seasonal patterns or identify months when expansion revenue unexpectedly slows down.
Looking only at cumulative MRR can hide important signals. A business may continue growing overall while Expansion MRR steadily declines, indicating that existing customers are no longer increasing their spending over time.
Tracking Expansion MRR growth rate
The total amount of Expansion MRR tells only part of the story. Many founders also monitor its growth rate to understand whether expansion is accelerating.
Imagine two SaaS companies:
Company
Expansion MRR
MRR growth
Company A
$12,000
+3%
Company B
$8,000
+28%
Although Company A generates more expansion revenue today, Company B's higher growth rate may indicate a healthier long-term trend.
Monitoring both values helps distinguish between mature SaaS companies with stable expansion and early-stage SaaS businesses that are rapidly improving their monetization.
Track Expansion MRR by customer cohort
Looking at Expansion MRR across the entire customer base can hide meaningful differences between user groups.
Instead, many SaaS companies analyze cohorts based on when customers joined. For example:
Customer cohort
Expansion after 12 months
Customers acquired in 2024
+12%
Customers acquired in 2025
+24%
Customers acquired in 2026
+31%
If newer cohorts consistently generate more expansion revenue, it may suggest that onboarding, product positioning, or pricing has improved.
Cohort analysis also helps determine whether product changes increase additional recurring revenue over time instead of simply boosting initial conversions.
Track Expansion MRR by pricing plan
Pricing is one of the biggest drivers of Expansion MRR.
If customers rarely move beyond the entry-level plan, the pricing structure may not provide enough incentives to upgrade. On the other hand, a well-designed pricing model creates clear reasons for customers to move to higher pricing tiers as their needs evolve.
A dashboard segmented by pricing tier might include:
Pricing tier
Customers
Expansion rate
Starter
18%
Low
Pro
41%
High
Business
27%
Medium
Enterprise SaaS
14%
High
This view helps founders identify which subscription plans create the strongest expansion opportunities.
Monitor Expansion MRR by acquisition channel
Not every customer acquisition channel produces customers with the same expansion potential.
For example, customers acquired through educational content may upgrade more frequently than customers coming from paid advertising. Likewise, referral customers often expand faster because they arrive with stronger product expectations.
Comparing revenue from existing customers across acquisition channels can reveal where the highest-quality customers originate.
A simplified example might look like this:
Acquisition channel
Expansion after 12 months
Organic search
+29%
Referrals
+34%
Product Hunt
+17%
Paid ads
+9%
Insights like these help founders optimize both customer acquisition strategy and long-term SaaS revenue growth.
Which SaaS metrics should be tracked alongside Expansion MRR?
Expansion MRR is valuable on its own, but it should never be analyzed in isolation. A company can generate strong expansion revenue while simultaneously losing customers through churn or downgrades.
That's why experienced SaaS founders evaluate Expansion MRR alongside a small set of complementary metrics. Together, they explain whether overall recurring subscription revenue is becoming healthier or whether growth depends too heavily on acquiring new customers.
Net revenue retention (NRR)
Net revenue retention is one of the most important SaaS metrics because it measures how revenue from an existing customer base changes over time.
NRR combines several factors:
Expansion MRR
Contraction
Downgrades
Churn
An NRR above 100% means existing customers are generating more recurring revenue than they did previously, even after accounting for customers who reduced spending or canceled their subscriptions.
For many investors, NRR is one of the strongest indicators of a healthy SaaS business.
Annual recurring revenue (ARR)
While Expansion MRR measures monthly increases, Annual Recurring Revenue (ARR) provides a broader picture of recurring subscription revenue on an annual basis.
Monitoring both metrics helps founders understand short-term momentum and long-term business growth.
Companies with steadily increasing ARR often also report consistent Expansion MRR, demonstrating that customers continue expanding their subscriptions over time.
Average revenue per account (ARPA)
Average Revenue Per Account measures how much revenue each customer generates on average.
If Expansion MRR is increasing while the number of customers remains relatively stable, ARPA should gradually rise as well.
Growing ARPA usually indicates that customers are purchasing higher pricing tiers, adding seats, or adopting additional features.
Customer lifetime value (LTV)
Customer Lifetime Value estimates the total revenue generated by a customer throughout their relationship with the company.
Expansion MRR directly increases lifetime value because customers spend more over a longer period.
For example, two businesses might have identical customer acquisition cost, but the company with stronger Expansion MRR will often achieve significantly higher LTV and better unit economics.
Expansion MRR as a growth metric
Rather than treating Expansion MRR as a standalone number, many founders view it as a leading growth metric that reflects the health of the product itself.
When customers consistently upgrade their subscriptions, purchase add-ons, or increase usage, it usually indicates that the product is becoming more valuable as their business grows.
Viewed alongside NRR, ARR, LTV, churn, and MRR growth, Expansion MRR helps explain not just how fast a SaaS company is growing, but how sustainable that growth is over the long term.
How to calculate Expansion MRR
Although most subscription analytics platforms calculate Expansion MRR automatically, every SaaS founder should understand how the metric is calculated. Knowing the formula makes it easier to validate dashboard data and identify reporting mistakes.
At its core, Expansion MRR is the sum of all recurring revenue increases generated by existing customers during a given period.
Expansion MRR formula
A simplified formula looks like this:
Expansion MRR = Revenue from upgrades + Additional recurring revenue from add-ons + Revenue from additional seats + Revenue from increased usage
Only recurring subscription revenue should be included in the calculation. One-time payments, implementation fees, consulting, or training services should not be counted because they do not contribute to future Monthly Recurring Revenue.
Example calculation
Suppose your SaaS business had the following account changes during April:
Customer action
Monthly increase
Upgrade to a higher pricing tier
$400
Additional user seats
$700
Add-on revenue
$300
Usage-based expansion
$600
Total Expansion MRR
$2,000
In this example, the company generated $2,000 in Expansion MRR from its existing customers.
If the same business also acquired $9,000 in New MRR and $1,000 in Reactivation MRR, the overall MRR growth for the month would be:
Source
Amount
New MRR
$9,000
Expansion MRR
$2,000
Reactivation MRR
$1,000
Total positive MRR growth
$12,000
Keeping these MRR components separate makes it much easier to understand which growth engine is contributing the most.
Common Expansion MRR calculation mistakes
Many founders accidentally inflate Expansion MRR by including revenue that doesn't belong in the calculation.
Some of the most common mistakes include:
Counting revenue from new customers as Expansion MRR.
Including one-time payments instead of recurring subscription revenue.
Ignoring downgrades and contraction when evaluating customer expansion.
Mixing Annual Recurring Revenue (ARR) with Monthly Recurring Revenue (MRR).
Measuring only total revenue generated instead of recurring revenue.
Another common mistake is evaluating Expansion MRR without considering churn. A company may report strong expansion revenue while simultaneously losing a similar amount through cancellations or revenue lost from downgrades. Looking only at Expansion MRR can therefore create an overly optimistic picture of business performance.
What drives Expansion MRR growth?
Expansion MRR doesn't happen by accident. It usually reflects a product that continues creating value after the initial purchase.
The most successful SaaS businesses intentionally design their pricing, onboarding, and product experience to encourage customers to expand naturally as their own businesses grow.
Upsells
Upselling is one of the largest contributors to Expansion MRR.
As customers become more successful with the product, they often need higher usage limits, advanced automation, additional integrations, or enterprise features. A clear upgrade path allows existing customers to move to a more suitable subscription without friction.
Cross-sells
Cross-selling involves offering complementary products or features that solve additional problems for the same customer.
Examples include:
analytics modules;
AI assistants;
reporting packages;
premium integrations;
security features.
Because these products are sold to an existing customer base, cross-sells often generate additional recurring revenue more efficiently than acquiring entirely new customers.
Usage-based pricing
Many modern SaaS companies use usage-based pricing instead of fixed subscription plans.
As customers process more transactions, send more emails, store more data, or consume more API requests, their monthly recurring revenue increases automatically.
In these businesses, Expansion MRR is closely tied to customer success. The more value customers receive, the more revenue they generate for the company.
Seat expansion
Products built for teams often experience expansion through additional seats.
For example, a customer may begin with five users and later expand to fifty as adoption spreads throughout the organization.
Seat expansion is particularly common in B2B collaboration software, CRM platforms, and productivity tools because growth naturally follows company adoption.
Add-on revenue
Recurring add-ons create another predictable source of Expansion MRR.
These may include premium storage, advanced reporting, additional automation credits, white-label functionality, or priority support.
Unlike one-time purchases, recurring add-ons increase Monthly Recurring Revenue every billing cycle, making them an important contributor to long-term SaaS revenue.
Which dashboards do SaaS founders use for tracking MRR?
Most founders don't calculate Expansion MRR manually every month. Instead, they rely on specialized subscription analytics platforms that automatically track Monthly Recurring Revenue, Annual Recurring Revenue, churn, contraction, upgrades, and other SaaS metrics.
The best dashboard depends on company size, billing system, and reporting requirements.
Stripe dashboards
For companies that use Stripe Billing, built-in dashboards provide a basic overview of subscription revenue.
Founders can monitor:
Monthly Recurring Revenue;
subscription revenue;
new customer growth;
recurring subscription revenue;
revenue generated from subscriptions.
While Stripe works well for operational reporting, many companies eventually require more advanced SaaS KPIs than Stripe provides out of the box.
ChartMogul
ChartMogul is one of the most widely used analytics platforms for subscription businesses.
It automatically tracks:
Expansion MRR;
New MRR;
Reactivation MRR;
contraction;
downgrade;
churn rate;
net revenue retention;
customer cohorts;
MRR increases over time.
Its cohort reporting is especially useful for understanding how recurring revenue from existing customers evolves after customers sign up.
Baremetrics
Baremetrics offers many of the same core capabilities while emphasizing simplicity and quick implementation.
Many founders use it to monitor:
monthly growth;
MRR growth;
customer acquisition;
cash flow;
lifetime value;
acquisition cost.
Its dashboards are designed to make trends easy to identify without requiring custom business intelligence tools.
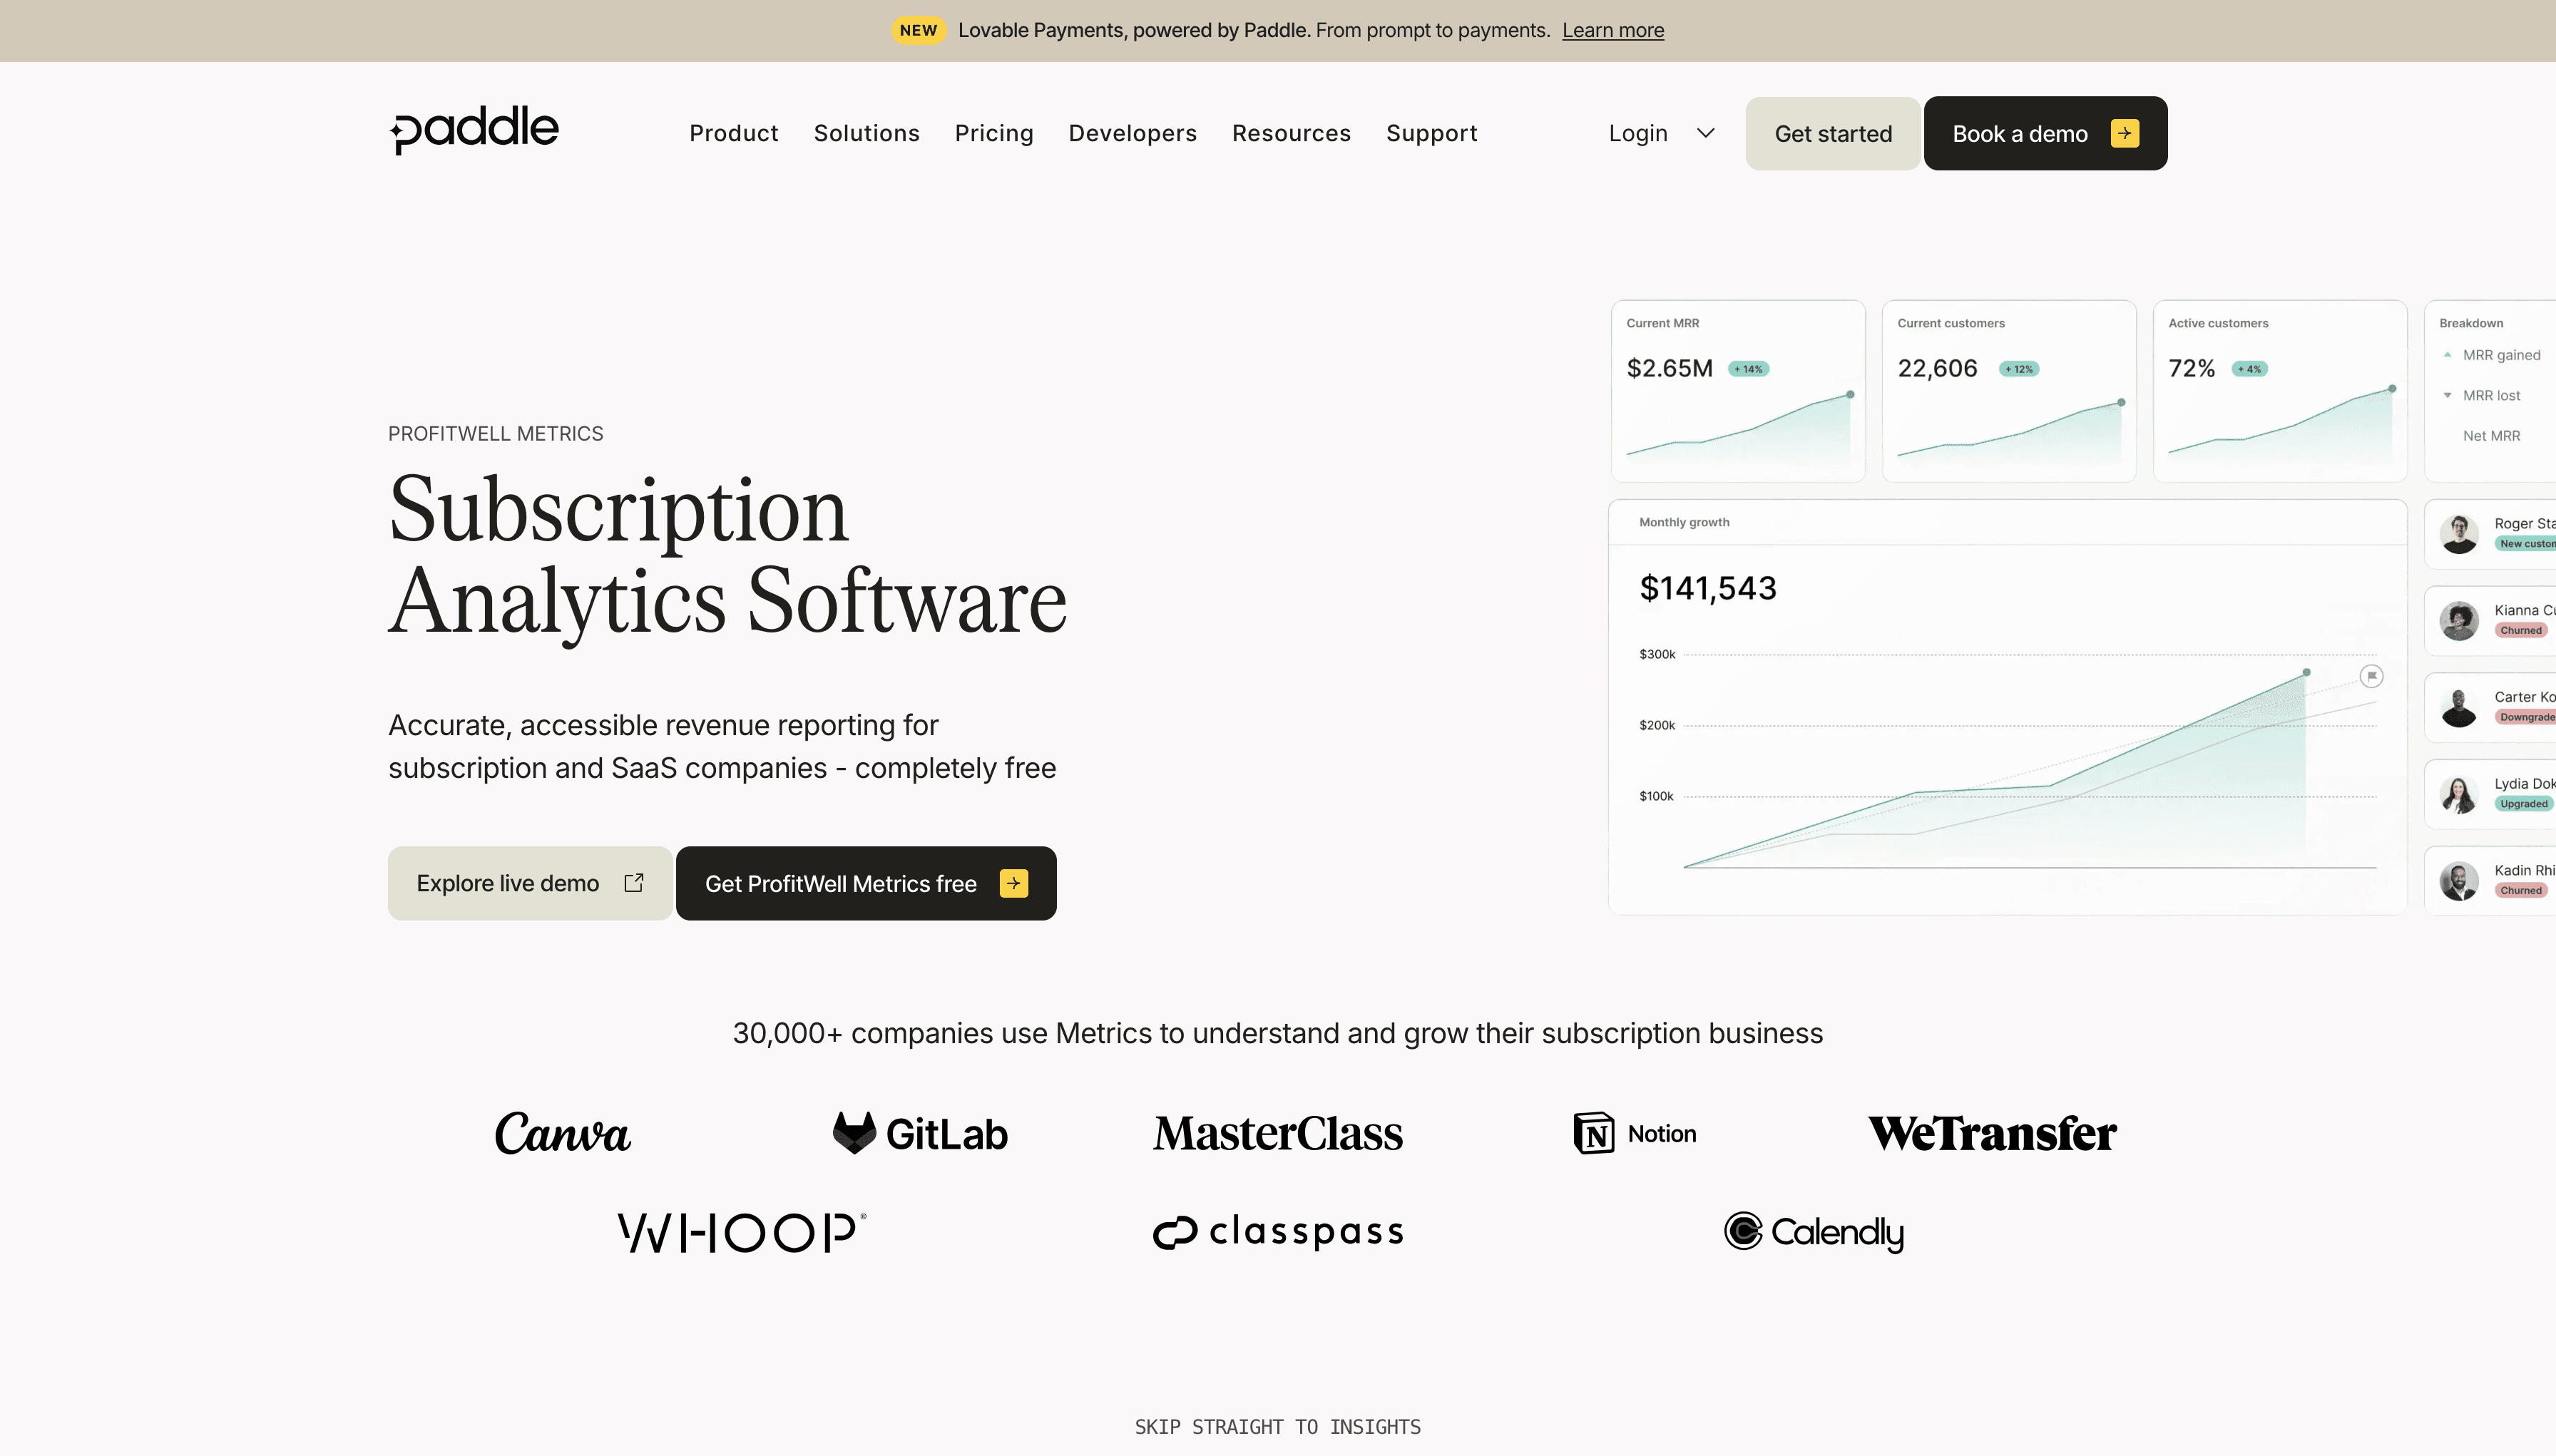
ProfitWell Metrics
ProfitWell Metrics focuses on subscription analytics and revenue optimization.
Beyond reporting Expansion MRR, it helps founders understand:
revenue churn;
contraction MRR;
pricing performance;
recurring revenue from existing customers;
negative net revenue churn opportunities.
These insights help identify where additional revenue from existing customers can be generated.
Custom MRR dashboard
As a SaaS business matures, many teams build custom dashboards using business intelligence platforms.
LTV, customer acquisition cost, average revenue per user
Bringing these metrics together allows founders to evaluate the overall health of the business instead of optimizing individual numbers in isolation.
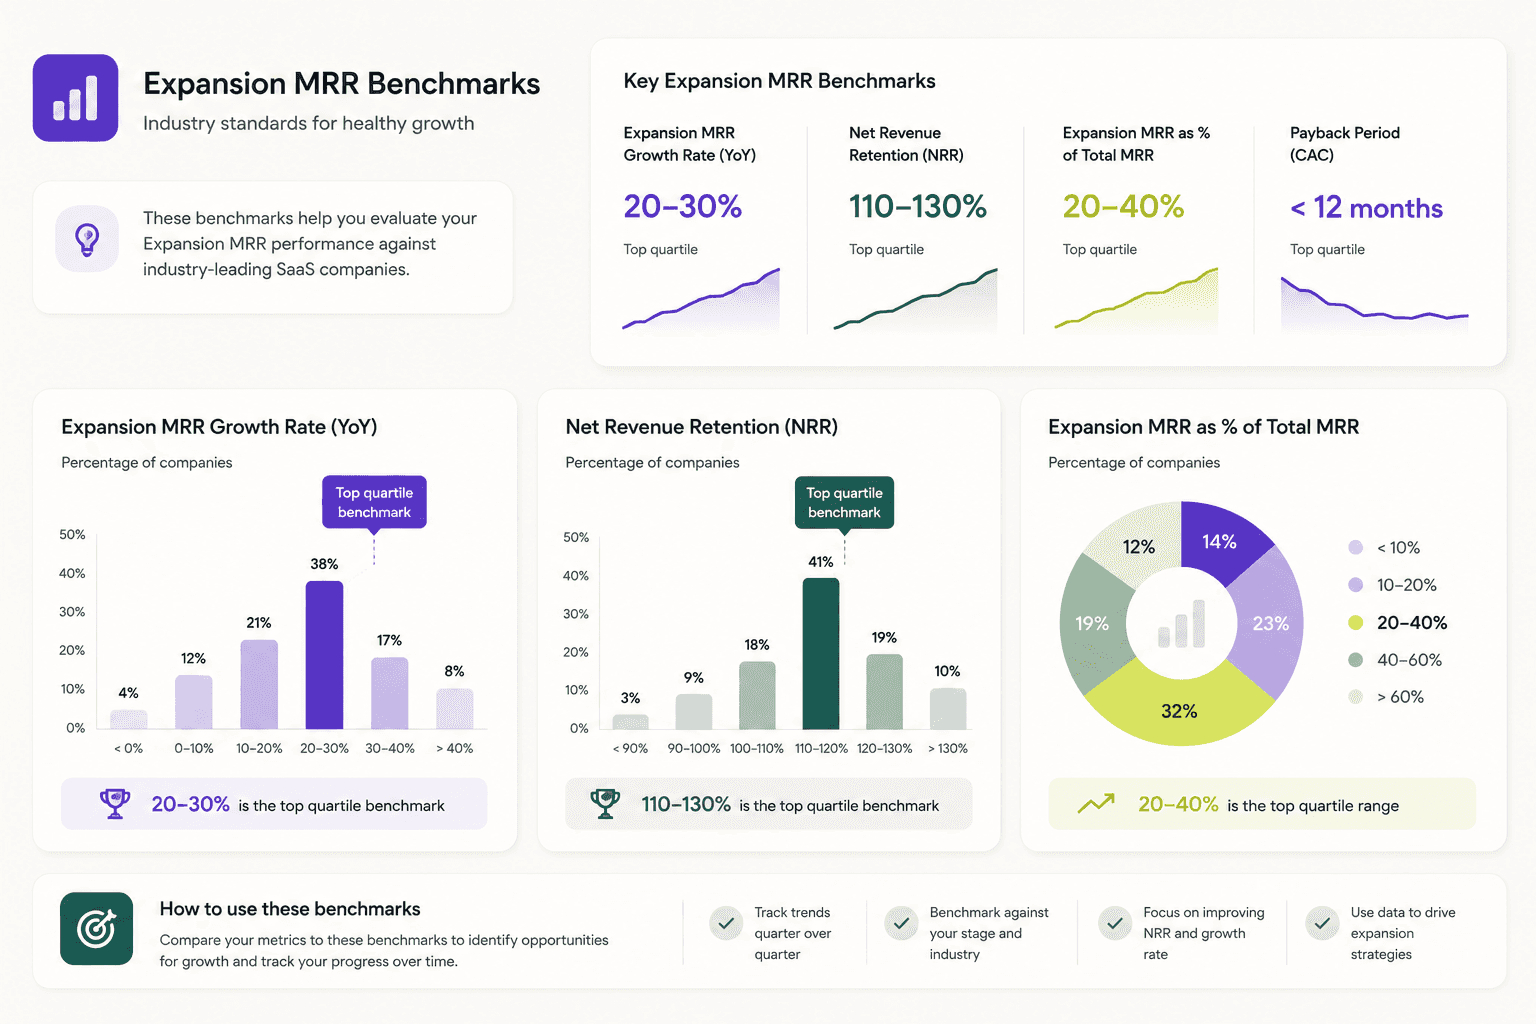
What is a good Expansion MRR growth rate?
There is no universal benchmark because Expansion MRR depends on pricing strategy, product maturity, and customer behavior.
An early-stage SaaS business may generate relatively little Expansion MRR simply because customers haven't been using the product long enough to upgrade. In contrast, mature SaaS companies often generate a substantial share of new recurring revenue from their existing customers.
Instead of comparing against a single benchmark, founders should ask whether Expansion MRR is increasing consistently over time and whether it offsets contraction and churn.
Common mistakes when tracking Expansion MRR
Even experienced founders occasionally misinterpret Expansion MRR by focusing on a single number instead of the broader context.
Some of the most common mistakes include:
treating New MRR as Expansion MRR;
ignoring contraction and downgrade trends;
optimizing for upgrades without improving customer success;
measuring Expansion MRR without monitoring net revenue retention;
evaluating expansion without cohort analysis;
focusing on revenue instead of long-term customer value.
Avoiding these mistakes produces a much clearer understanding of a SaaS company's revenue growth and helps build healthier SaaS companies over the long term.
Frequently asked questions
What is the difference between Expansion MRR and ARR?
Expansion MRR measures additional Monthly Recurring Revenue generated by existing customers. ARR is the annualized value of recurring subscription revenue across the entire business.
Is Expansion MRR included in net revenue retention?
Yes. Expansion MRR is one of the primary inputs used to calculate net revenue retention, alongside contraction, downgrades, and churn.
How often should SaaS founders track Expansion MRR?
Most founders review Expansion MRR monthly. Tracking MRR monthly makes it easier to identify trends, compare customer cohorts, and measure the impact of pricing or product changes.
Can a SaaS business grow mainly through Expansion MRR?
Yes. Many top-performing SaaS companies generate a large share of their long-term revenue growth from existing customers rather than relying exclusively on acquiring new customers. As products mature and customer relationships deepen, Expansion MRR often becomes one of the most efficient drivers of sustainable growth.
Subscribe to newsletter that helps SaaS founders get unstuck from mind blocks, blind spots, and skill gaps.
Free newsletter. Unsubscribe anytime.
3,000+
Subscribers
Subscribe to newsletter that helps SaaS founders get unstuck from mind blocks, blind spots, and skill gaps.
Free newsletter. Unsubscribe anytime.
3,000+
Subscribers
Subscribe to newsletter that helps SaaS founders get unstuck from mind blocks, blind spots, and skill gaps.
Free newsletter. Unsubscribe anytime.
3,000+
Subscribers
Subscribe to newsletter that helps SaaS founders get unstuck from mind blocks, blind spots, and skill gaps.