Customer support metrics help SaaS companies measure how efficiently their support team resolves customer issues and how those interactions affect customer satisfaction, retention, and long-term growth. While dozens of support KPIs are available, the most important ones include first response time, average resolution time, first contact resolution, CSAT, ticket volume, SLA compliance, and customer retention after support interactions.
The challenge is not collecting more data. Modern help desk platforms like Zendesk, Intercom, Freshdesk, Help Scout, and Jira Service Management generate hundreds of reports automatically. The real challenge is identifying which metrics actually improve the customer experience and which simply create noise. Tracking the right metrics allows every SaaS business to make better decisions, improve support operations, and retain more customers without overwhelming teams with unnecessary dashboards.
In this guide, you'll learn which customer support metrics every SaaS company should track, what each metric measures, when it matters most, and how to build a practical metrics dashboard that supports business growth.
Industry research published in Zendesk's Customer Experience Trends Report consistently shows that customers value fast, high-quality support as much as product functionality itself.
Why customer support metrics matter for SaaS companies
For many SaaS companies, customer support is no longer just a cost center. It has become one of the strongest drivers of customer retention, expansion revenue, and long-term loyalty. Every support conversation influences how customers perceive your product, whether they continue their subscription, and whether they recommend your software to others.
Without meaningful metrics, support teams often judge performance by intuition. A busy inbox may feel productive, while a low ticket volume may seem like success. In reality, neither metric tells the full story. Customer support metrics show how effectively your team responds to problems, resolves issues, and creates positive customer experiences.
They also create alignment across departments. Support leaders monitor operational metrics such as response times and backlog, customer success teams focus on retention and expansion, while executives look at broader business outcomes. When everyone works from the same KPIs, it becomes much easier to identify bottlenecks and prioritize improvements.
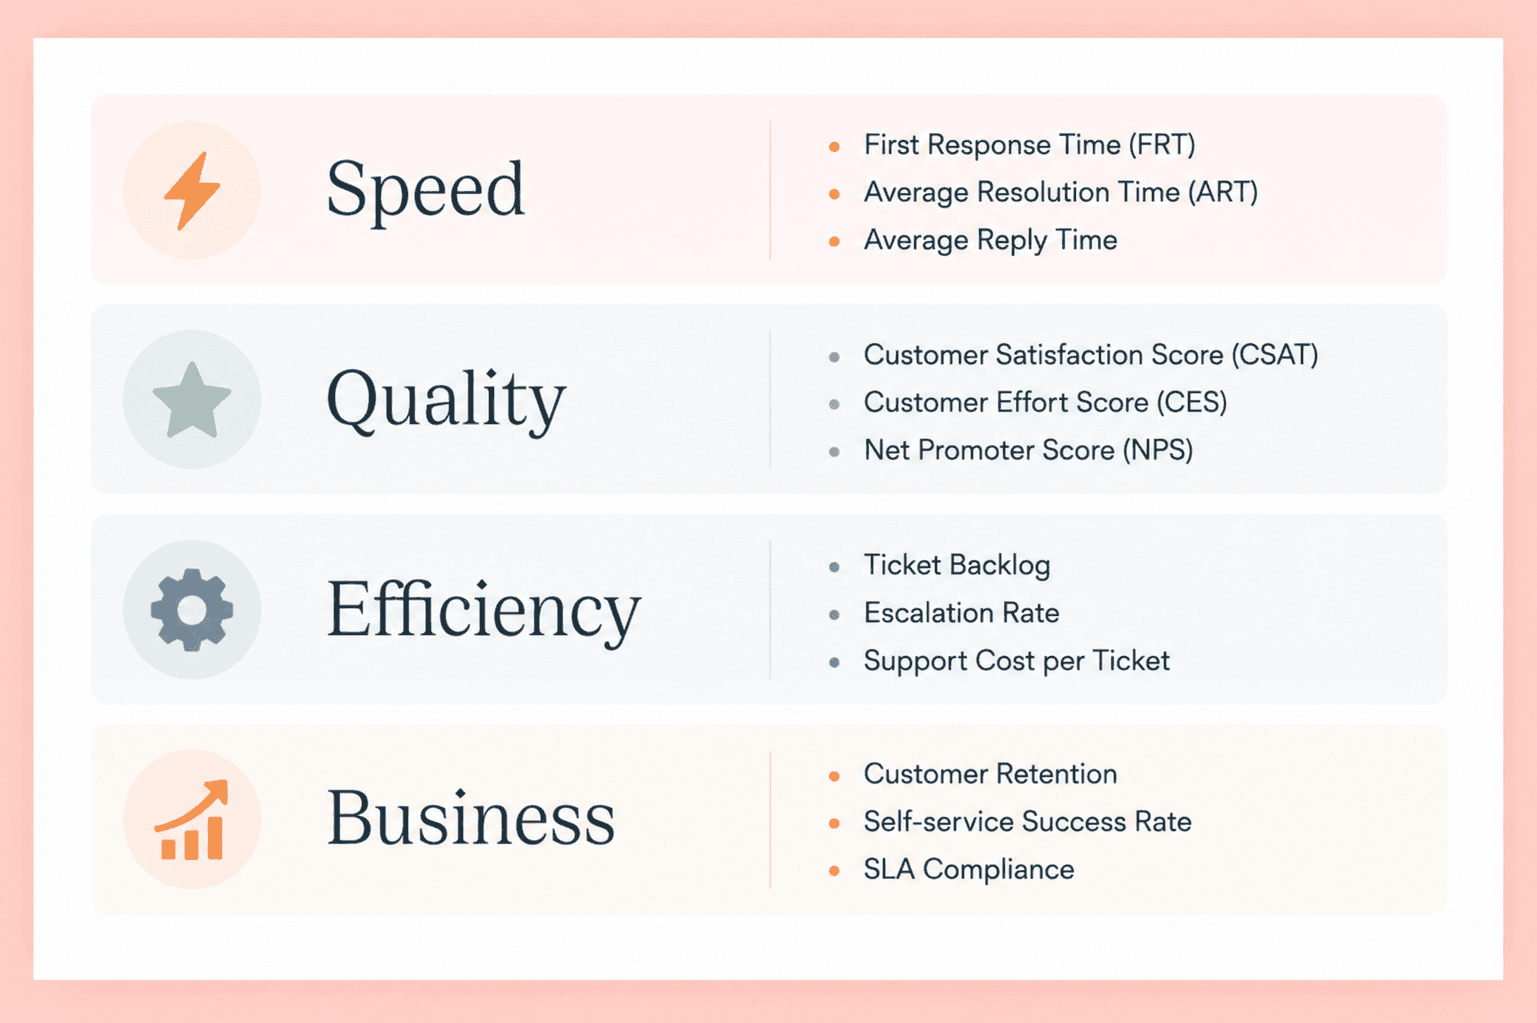
The table below summarizes how different categories of support metrics contribute to SaaS performance.
Metric category
Measures
Business impact
Speed metrics
How quickly the team responds and resolves issues
Faster support and improved customer experience
Quality metrics
Customer satisfaction and issue resolution quality
Higher loyalty and customer retention
Efficiency metrics
Team productivity and workload
Lower support costs and better resource allocation
Business metrics
How support affects retention and revenue
Stronger SaaS growth and healthier recurring revenue
Not every SaaS business needs dozens of KPIs. Early-stage startups usually benefit from monitoring a small set of critical metrics, while larger organizations often build more sophisticated metrics dashboards. The goal is not to track everything. The goal is to measure the indicators that directly support business objectives.
How customer support affects customer retention and SaaS growth
Support is often the last human interaction a customer has before deciding whether to stay or leave. A product may have excellent features, but repeated delays, unresolved tickets, or poor communication can quickly damage trust.
Research consistently shows that customers who receive fast, effective support are more likely to renew subscriptions and recommend a product to others. In contrast, unresolved issues increase frustration, reduce product adoption, and contribute to customer churn. This is why support metrics should never be viewed in isolation. They directly influence customer retention, customer satisfaction, and overall SaaS growth.
Support also plays a valuable role in product development. Ticket trends reveal recurring pain points, feature requests, onboarding issues, and usability problems. When product teams review these metrics regularly, they gain a reliable source of customer feedback that can influence future releases.
Why every SaaS business should track support KPIs
Every SaaS business should track support KPIs because they transform individual customer conversations into measurable business insights. Instead of relying on assumptions, managers can identify patterns, compare performance over time, and make informed operational decisions.
Well-designed KPIs also make benchmarking possible. For example, a first response time of four hours might be acceptable for one company but far too slow for another with enterprise SLA commitments. Measuring the same metric consistently allows SaaS companies to evaluate progress against their own historical performance instead of chasing arbitrary industry numbers.
Another important advantage is accountability. When metrics are visible across the organization, support teams understand what success looks like, managers can coach more effectively, and leadership gains confidence that customer support contributes to broader business goals rather than operating as an isolated department.
By treating customer support as a measurable function instead of a reactive service, SaaS companies create a stronger foundation for sustainable growth.
15 essential customer support metrics every SaaS company should track
Once you've established why customer support metrics matter, the next step is deciding which ones deserve a place on your metrics dashboard. Not every KPI carries the same weight. Some measure operational efficiency, others reflect customer satisfaction, while a few reveal how support contributes to customer retention and long-term SaaS growth.
The metrics below provide a balanced view of support performance. Together, they show how well your team responds to customers, resolves problems, manages workload, and delivers an experience that keeps users coming back.
1. First response time (FRT)
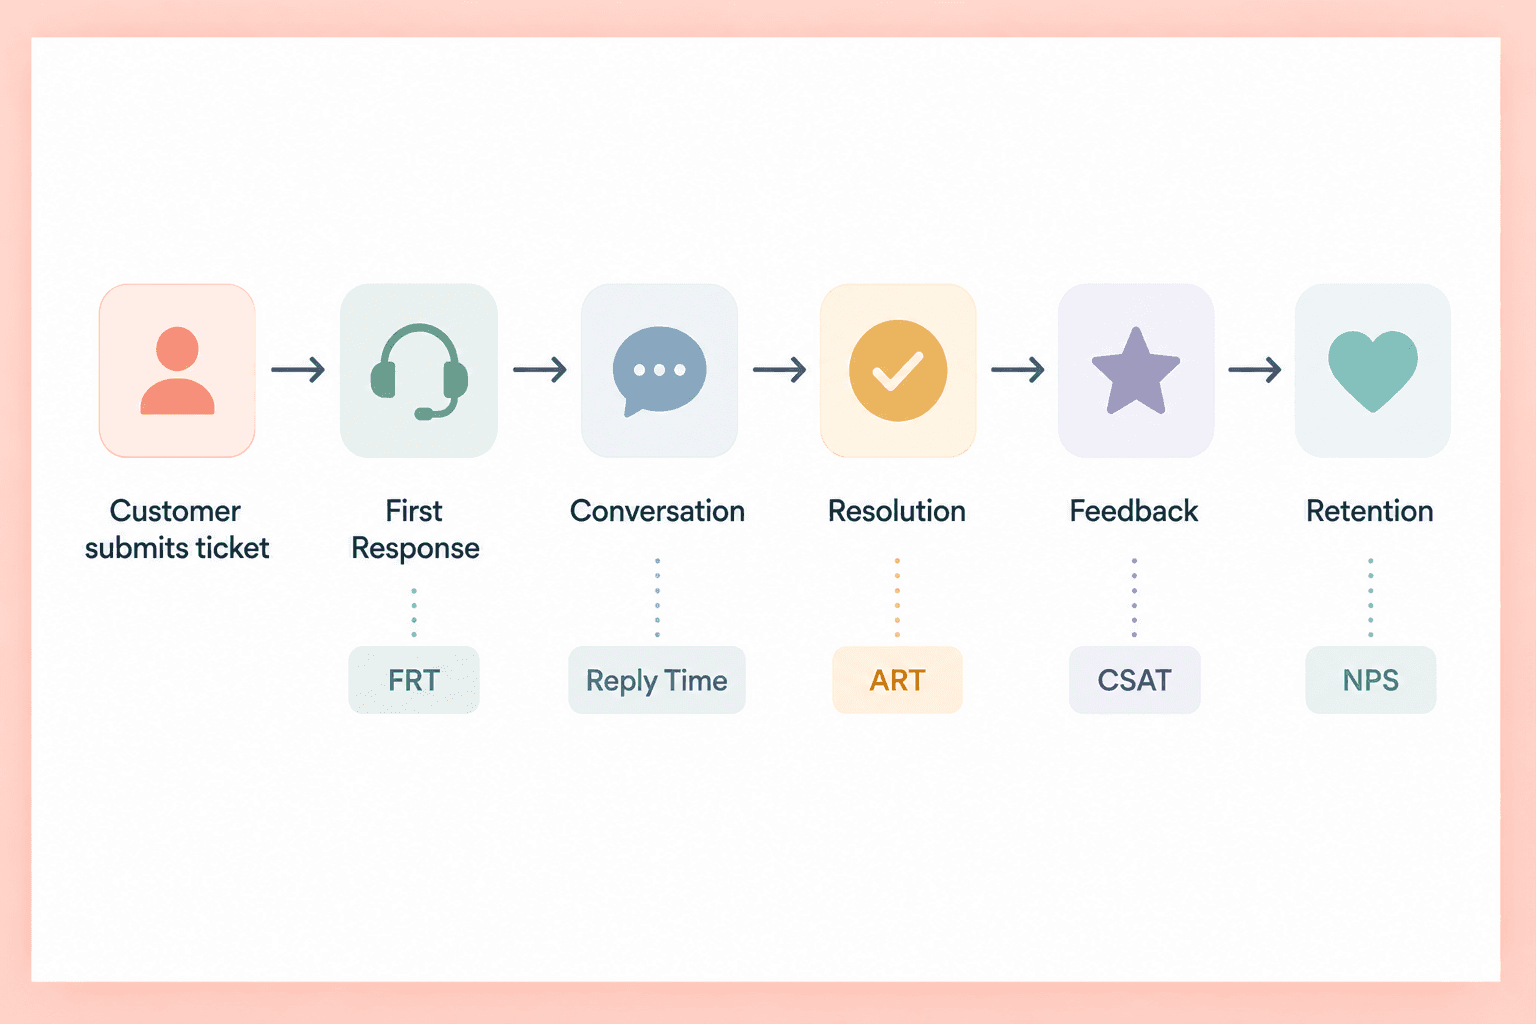
First response time measures how long it takes your support team to send the first meaningful reply after a customer submits a ticket. It is often the first metric customers notice because it shapes their initial impression of your support experience.
A fast response reassures customers that someone is working on their issue, even if the problem cannot be resolved immediately. Conversely, long delays create uncertainty and frustration, particularly for customers experiencing product outages or business-critical issues.
Monitor this metric separately for different communication channels whenever possible. Live chat, email, and support portals naturally have different response expectations.
What it measures
Why it matters
Time until the first human response
Sets customer expectations and improves satisfaction
2. Average resolution time (ART)
While first response time measures speed, average resolution time measures effectiveness. It calculates how long it takes to fully solve a customer's issue from the moment a ticket is created until it is closed.
Reducing resolution time improves customer satisfaction and allows support teams to handle more requests without increasing headcount. However, faster is not always better. Closing tickets prematurely often leads to reopened cases and frustrated customers.
Instead of chasing the shortest possible resolution time, aim for consistent improvements while maintaining high service quality.
3. First contact resolution (FCR)
First contact resolution measures the percentage of support requests solved during the first interaction without requiring follow-up conversations.
This is one of the strongest indicators of support quality because customers generally prefer quick, complete answers over multiple back-and-forth exchanges. High FCR usually reflects well-trained agents, strong documentation, and efficient internal processes.
Improving this metric often reduces ticket volume naturally because customers spend less time reopening issues or requesting additional clarification.
4. Customer satisfaction score (CSAT)
Customer satisfaction score is one of the most widely used customer support metrics. After a support interaction, customers are typically asked to rate their experience on a simple scale such as one to five stars.
Unlike operational metrics, CSAT captures the customer's perception of the interaction rather than the team's internal performance.
High CSAT scores generally indicate that customers received timely, helpful, and professional support. Declining scores, however, may signal communication problems even when response times appear healthy.
5. Net Promoter Score (NPS)
Net Promoter Score (NPS), introduced by Fred Reichheld and popularized through Bain & Company, measures overall customer loyalty rather than individual support interactions.
Customers answer a single question:
"How likely are you to recommend our product to a friend or colleague?"
Because NPS reflects the entire customer experience, it should not be treated as a pure support KPI. However, combining NPS with support metrics often reveals useful patterns. For example, companies with consistently slow resolution times frequently experience declining customer satisfaction and lower loyalty over time.
6. Customer effort score (CES)
Customer effort score measures how easy it was for customers to resolve their issue.
Instead of asking whether customers were happy, CES focuses on how much effort they had to invest. Did they find the answer immediately? Did they need to explain the same problem multiple times? Were they transferred between agents?
Many SaaS companies consider this an important metric because reducing customer effort often improves both customer retention and product adoption.
7. Ticket volume
Ticket volume simply measures how many support requests your team receives during a given period.
By itself, this metric says very little. A growing SaaS business naturally generates more tickets as its customer base expands. The real value comes from analyzing ticket volume alongside customer growth, active users, product releases, and customer acquisition.
Unexpected spikes frequently reveal product bugs, onboarding issues, or infrastructure problems before other departments notice them.
8. Ticket backlog
Ticket backlog represents the number of unresolved support requests waiting to be handled.
A temporary backlog during product launches or major incidents is normal. A consistently growing backlog, however, usually indicates insufficient staffing, inefficient workflows, or recurring product problems.
Rather than measuring backlog alone, monitor how quickly it grows and how long tickets remain unresolved. These trends provide a much clearer picture of support capacity.
9. SLA compliance
Service Level Agreement (SLA) compliance measures how consistently your support team meets promised response and resolution times.
This metric is particularly important for B2B SaaS companies serving enterprise customers. Missing SLA targets can affect customer trust, contract renewals, and in some cases financial penalties.
Instead of tracking SLA compliance globally, many SaaS companies report separate compliance rates for different priority levels, such as critical, high, medium, and low severity tickets.
10. Average reply time
Average reply time measures how long customers wait between messages after an initial conversation has already started.
Unlike first response time, this metric evaluates the ongoing pace of communication throughout the support process.
Long reply times often make even simple issues feel unnecessarily complicated. Customers may perceive the support experience as slow despite receiving an initial response quickly.
A balanced metrics dashboard should therefore monitor both first response time and average reply time together. They measure different stages of the customer journey and often reveal different operational bottlenecks.
11. Ticket reopen rate
A reopened ticket usually indicates that the original issue was not fully resolved. While occasional reopen requests are expected, a consistently high reopen rate often points to rushed ticket closures, incomplete troubleshooting, or communication gaps.
This metric is particularly valuable because it balances speed metrics. A support team can reduce average resolution time simply by closing tickets earlier, but if customers immediately reopen them, the apparent improvement is misleading.
Review reopened tickets regularly to identify recurring patterns. They often reveal opportunities to improve internal documentation, product knowledge, or troubleshooting workflows.
12. Escalation rate
Escalation rate measures how often support requests need to be transferred to senior agents, engineering teams, or product specialists.
A high escalation rate is not automatically a problem. Complex B2B SaaS products naturally require collaboration across departments. However, a rising escalation rate may indicate that frontline agents lack training, internal documentation, or the authority to resolve common issues independently.
Tracking this metric alongside first contact resolution provides a clearer picture of support effectiveness.
13. Self-service success rate
Many SaaS companies invest in AI assistants, knowledge bases, and help centers using platforms like Intercom or Zendesk to reduce repetitive support requests. Self-service success rate measures how often customers solve their problems without contacting the support team.
Improving this metric benefits both customers and support operations. Customers receive immediate answers, while agents can spend more time handling complex cases that require human expertise.
Useful indicators include:
Knowledge base article completion rates
Search success within the help center
AI chatbot resolution rates
Percentage of sessions that do not result in a support ticket
As AI-powered support becomes more common, self-service metrics are becoming increasingly important for every SaaS business.
14. Support cost per ticket
Support cost per ticket measures how much it costs your business to resolve a single customer request.
The calculation typically includes salaries, software subscriptions, infrastructure, outsourcing costs, and other operational expenses divided by the number of resolved tickets.
Lower costs are generally positive, but they should never come at the expense of customer satisfaction. The objective is sustainable efficiency rather than aggressive cost reduction.
For example, investing in better documentation or automation may increase costs initially while reducing support expenses over time.
15. Customer retention after support interactions
This is one of the most valuable business metrics because it connects customer support directly to business outcomes.
Instead of measuring support activity alone, it evaluates whether customers who interacted with support continue using the product, renew subscriptions, or expand their accounts.
For subscription businesses, this metric often answers the most important question:
Does our support team help customers stay with us?
Companies that combine operational metrics with customer retention data gain a much clearer understanding of support's business impact than those focusing only on response times or ticket counts.
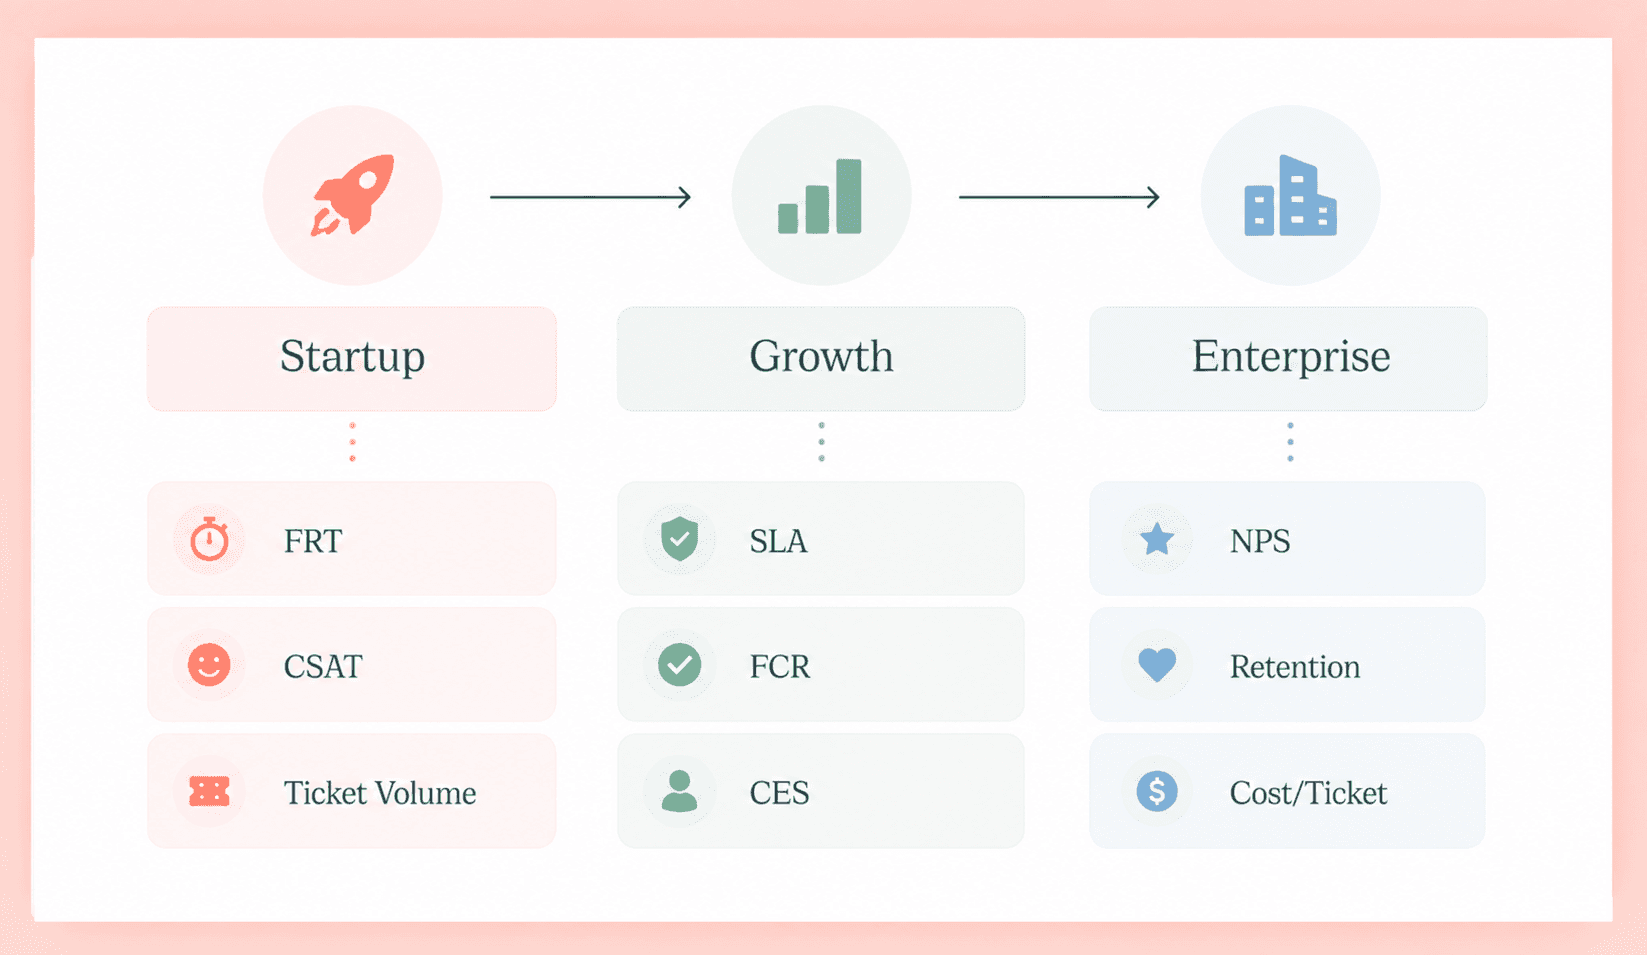
Which support metrics every SaaS business should track at each stage
The right metrics evolve as a SaaS company grows. Early-stage startups typically need visibility into operational performance, while larger organizations require a broader set of customer success and business metrics.
The table below provides a practical starting point.
SaaS stage
Highest-priority metrics
Early-stage SaaS business
First response time, average resolution time, CSAT, ticket volume
Growing SaaS companies
FCR, SLA compliance, ticket backlog, escalation rate, CES
Enterprise SaaS companies
Customer retention, support cost per ticket, NPS, self-service success rate, advanced SLA reporting
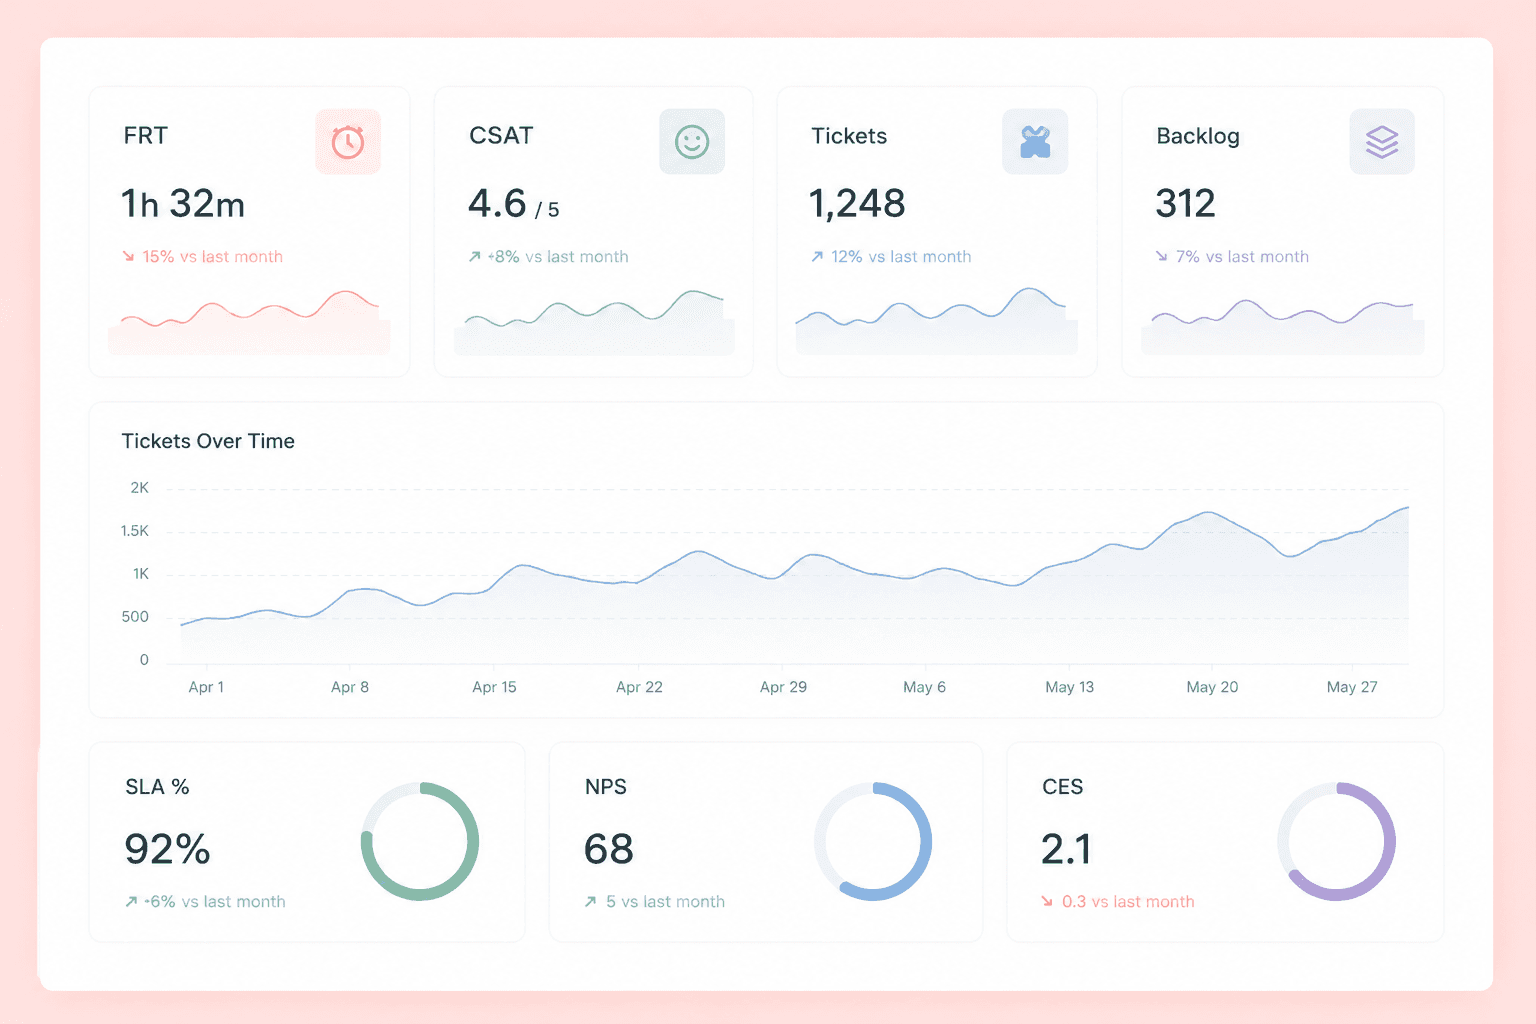
Rather than building an extensive metrics dashboard from day one, start with a handful of important metrics and expand gradually as your support organization matures.
How to choose the right support metrics for your SaaS business
The best metrics dashboard is not the one with the most charts. It is the one that helps your team make better decisions.
A useful framework is to ask three questions before adding any KPI:
Does this metric measure something we can improve?
Does it support a business objective?
Will we take action if this number changes?
If the answer to all three questions is yes, the metric probably belongs on your dashboard.
Focus on the metrics that support business goals
Every metric should connect to a measurable business objective. For example:
Business goal
Relevant metrics
Improve customer satisfaction
CSAT, CES, first response time
Increase customer retention
FCR, customer retention after support interactions, NPS
Improve operational efficiency
Average resolution time, ticket backlog, support cost per ticket
Scale support without hiring proportionally
Self-service success rate, escalation rate
This approach prevents dashboards from becoming collections of interesting but ultimately unused numbers.
Connect customer support KPIs with customer success
Support should not operate independently from customer success.
When support metrics are analyzed alongside customer health scores, product adoption, renewals, and expansion revenue, companies gain a much deeper understanding of the customer lifecycle.
For example, customers submitting multiple unresolved tickets may also show declining product usage several weeks before they cancel. Identifying these patterns allows customer success teams to intervene earlier.
Review different metrics together instead of in isolation
Every metric has limitations when viewed alone.
A shorter resolution time may indicate greater efficiency, or it may simply mean tickets are being closed too quickly. High CSAT scores may hide growing ticket volumes. Low ticket counts may reflect an excellent product, or they may indicate customers have stopped using it altogether.
The strongest dashboards combine operational, quality, efficiency, and business metrics to provide balanced decision-making.
How to build a customer support metrics dashboard
A practical metrics dashboard should remain simple enough for teams to review consistently.
One effective approach is to organize metrics by review frequency.
Daily
Weekly
Monthly
Ticket backlog
FCR
Customer retention
First response time
Escalation rate
NPS
Average reply time
CSAT
Support cost per ticket
SLA compliance
Ticket volume trends
Self-service success rate
This structure allows teams to react quickly to operational issues while giving leadership enough context to evaluate long-term performance.
Common mistakes when tracking customer support metrics
Many SaaS companies collect far more data than they actually use. The following mistakes appear repeatedly.
Tracking too many metrics without clear business objectives.
Prioritizing response speed over problem resolution.
Measuring individual agent productivity while ignoring customer outcomes.
Using benchmarks without considering company size, product complexity, or customer expectations.
Failing to review trends over time and focusing only on weekly fluctuations.
Remember that metrics are tools for decision-making, not goals in themselves. A healthy support organization uses data to improve customer outcomes rather than simply producing attractive reports.
Frequently asked questions
What customer support metrics should every SaaS company track?
Every SaaS company should monitor first response time, average resolution time, first contact resolution, CSAT, ticket volume, SLA compliance, and customer retention after support interactions. These metrics provide a balanced view of operational efficiency, customer satisfaction, and business impact.
What is the most important support metric for a SaaS company?
There is no single best metric. Customer satisfaction, first response time, and customer retention together provide a more complete picture than any individual KPI.
How often should SaaS companies review support metrics?
Operational metrics such as response time, backlog, and SLA compliance should be reviewed daily or weekly. Business metrics including customer retention, NPS, and support costs are typically reviewed monthly.
What is a good first response time for B2B SaaS?
The ideal benchmark depends on the communication channel and SLA commitments. Live chat often targets responses within minutes, while email support commonly aims for responses within a few hours. Enterprise contracts may define stricter requirements for critical issues.
What is the difference between CSAT, CES, and NPS?
CSAT measures satisfaction with a specific support interaction. CES measures how much effort customers expend to resolve an issue. NPS measures overall customer loyalty and the likelihood of recommending your product.
Final thoughts
Customer support metrics do far more than evaluate your support team. They reveal how customers experience your product, where operational bottlenecks exist, and how support contributes to customer retention and SaaS growth.
Instead of trying to measure everything, begin with a focused set of KPIs that align with your business goals. As your SaaS business grows, your metrics dashboard can evolve alongside it. The companies that consistently improve customer support are rarely the ones tracking the most metrics. They measure the right metrics, review them regularly, and act on what the data reveals.
Subscribe to newsletter that helps SaaS founders get unstuck from mind blocks, blind spots, and skill gaps.
Free newsletter. Unsubscribe anytime.
3,000+
Subscribers
Subscribe to newsletter that helps SaaS founders get unstuck from mind blocks, blind spots, and skill gaps.
Free newsletter. Unsubscribe anytime.
3,000+
Subscribers
Subscribe to newsletter that helps SaaS founders get unstuck from mind blocks, blind spots, and skill gaps.
Free newsletter. Unsubscribe anytime.
3,000+
Subscribers
Subscribe to newsletter that helps SaaS founders get unstuck from mind blocks, blind spots, and skill gaps.