Finance
What is the average churn rate for a SaaS company?

, Community Leader
29 minutes


The average churn rate for a SaaS company is typically around 3–7% per month for smaller SaaS businesses, while larger B2B and enterprise SaaS companies often experience much lower churn. However, no single SaaS churn rate works as a benchmark for every company. Churn rates vary significantly depending on customer type, average revenue per account (ARPA), contract length, company maturity, and whether you measure customer churn or revenue churn.
Recent SaaS churn benchmarks illustrate just how wide that range can be. ChartMogul's analysis of more than 2,500 SaaS businesses found a median monthly customer churn rate of 6.5% for companies below $300K ARR, compared with 3.7% for companies at $1–3M ARR and 3.1% for companies above $8M ARR.
This means that asking whether your churn is “good” requires more context than comparing it with one average SaaS churn rate. A 5% monthly churn rate might be concerning for an established enterprise SaaS product but relatively normal for an early-stage, low-ARPA subscription business.
What is the average churn rate for a SaaS company?
There is no universal average churn rate for SaaS because different SaaS companies serve very different customers. A self-service product charging $20 per month and an enterprise SaaS platform with six-figure annual contracts operate under completely different retention dynamics.
As a broad reference point, Paddle puts average SaaS churn at around 5%, while noting that actual rates vary widely across companies and industries. Its data also shows a strong relationship between pricing and churn: businesses with less than $100 in average revenue per user tend to experience substantially higher revenue churn than businesses earning more than $500 per user.
A more useful approach is therefore to compare your SaaS business with companies of a similar size, customer segment, and pricing model rather than treating one industry-wide number as the target.
Average SaaS churn rate benchmarks
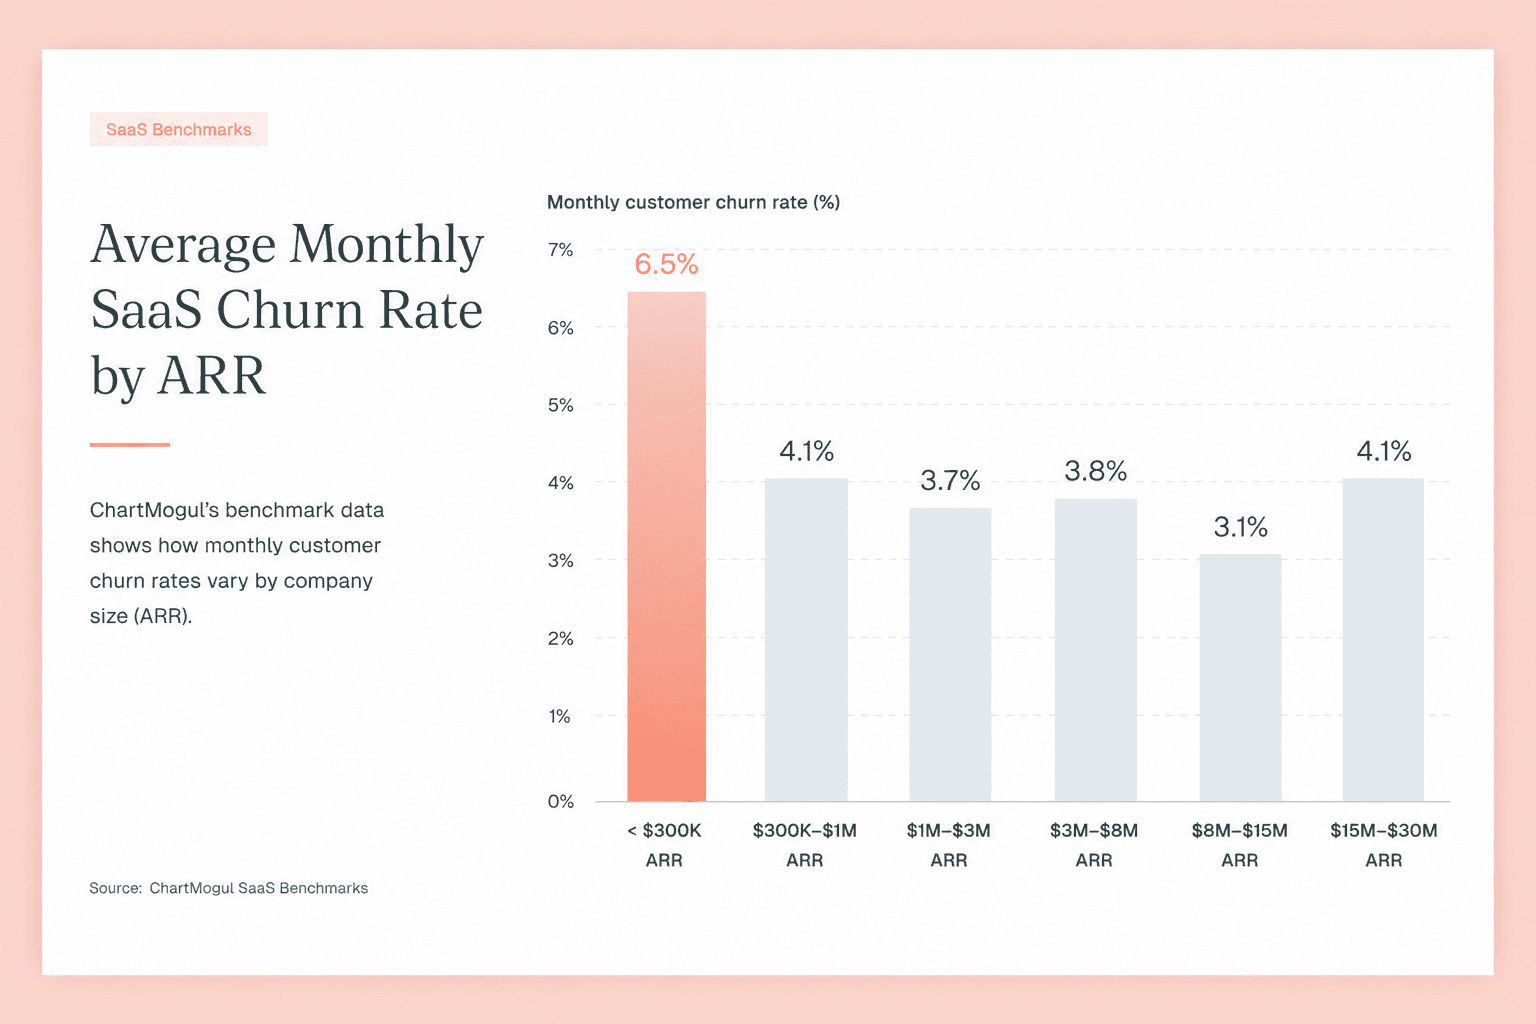
ChartMogul's SaaS churn data provides useful benchmarks because it separates companies by ARR instead of combining the entire SaaS industry into a single average. Its customer churn benchmarks look like this:
ARR | Median monthly customer churn rate |
|---|---|
Under $300K | 6.5% |
$300K–$1M | 4.1% |
$1M–$3M | 3.7% |
$3M–$8M | 3.8% |
$8M–$15M | 3.1% |
$15M–$30M | 4.1% |
The broader pattern matters more than small differences between individual ARR bands. Early-stage SaaS companies generally experience higher churn, while churn tends to fall as companies find stronger product-market fit, improve customer targeting, and build more mature retention processes.
Average revenue per account tells a similar story. Among SaaS companies with an ARPA below $25, ChartMogul reports median monthly customer churn of 6.1%. At $100–$250 ARPA, the median falls to 3.1%, and for companies above $1,000 ARPA it falls to 1.8%.
Average monthly churn rate for SaaS companies
Monthly churn rate is particularly useful for SaaS companies with monthly subscriptions because it shows how quickly customers or recurring revenue are disappearing from the existing customer base.
For smaller SaaS companies, monthly customer churn of several percentage points is common. ChartMogul reports a 6.5% median for SaaS businesses below $300K ARR, while the top decile in that segment achieves just 1.5%. For companies between $1M and $3M ARR, those figures fall to 3.7% for the median company and 1.3% for the top decile.
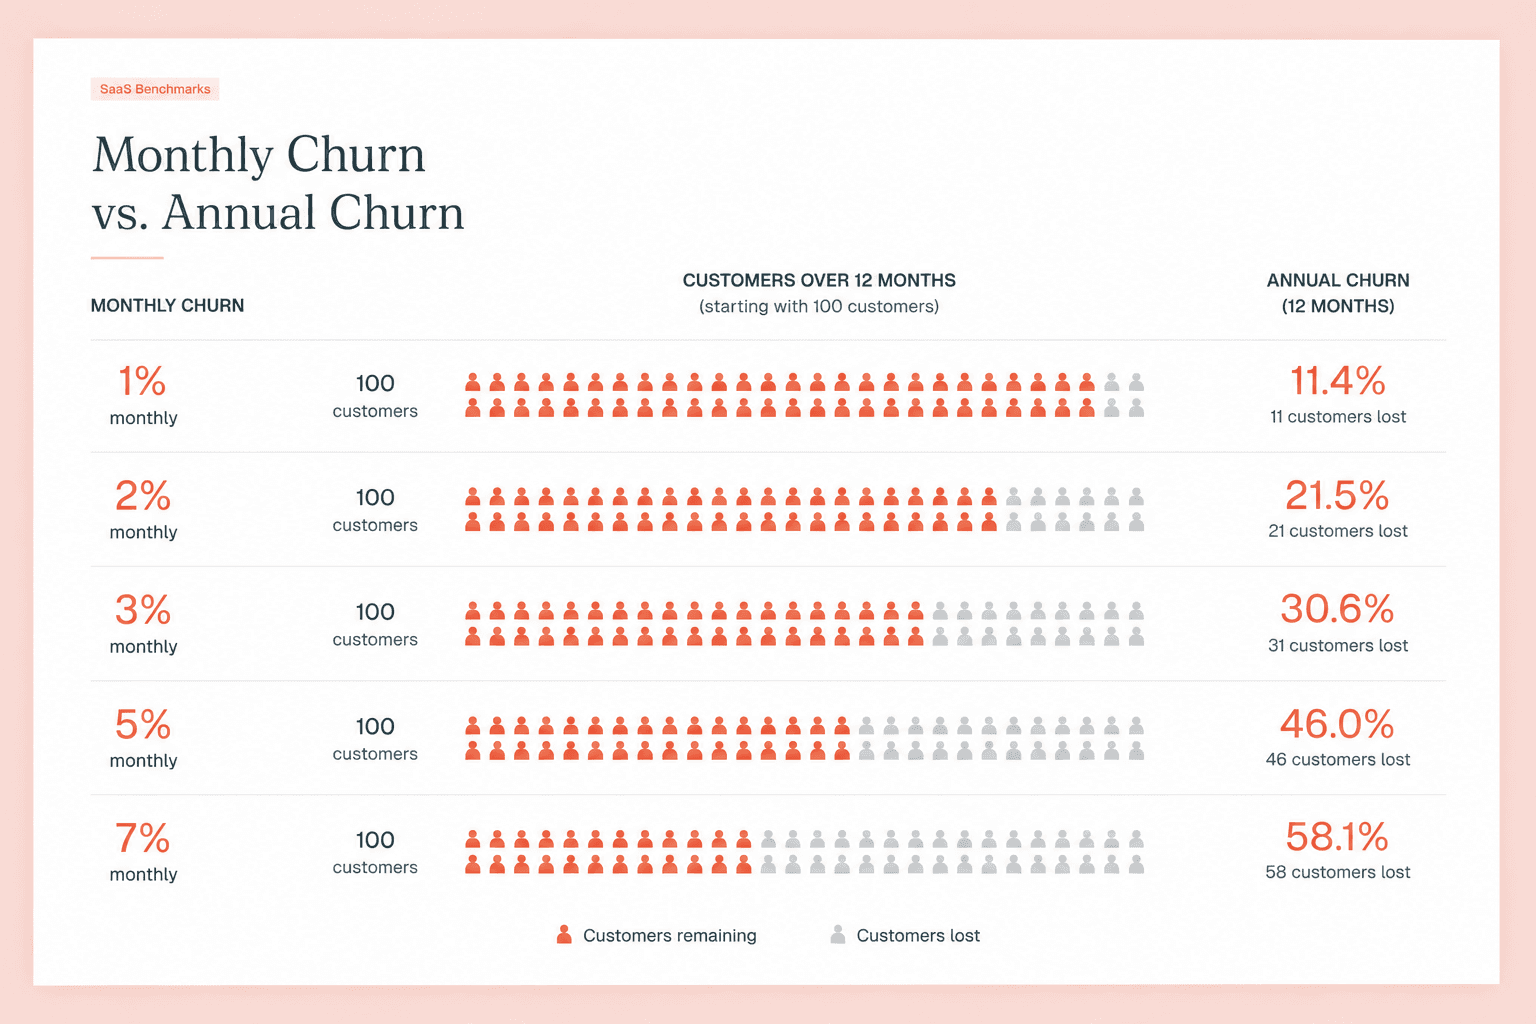
The difference may seem small month to month, but churn compounds. If a company starts with 1,000 customers and loses 5% of the remaining customer base every month without adding new customers, only about 540 would remain after 12 months. At 2% monthly churn, roughly 785 would remain.
That is why even apparently modest differences in monthly churn can have a major financial impact over time.
Average annual churn rate for SaaS companies
Annual churn rate needs to be interpreted carefully. You cannot simply multiply a monthly churn rate by 12 because the customer base shrinks each month.
For example, a 5% monthly customer churn rate compounds to roughly 46% annual churn, assuming the monthly rate remains constant. A 2% monthly rate compounds to about 22% annually, while 1% monthly churn translates to approximately 11% annual churn.
Monthly churn | Approximate annual churn |
|---|---|
1% | 11.4% |
2% | 21.5% |
3% | 30.6% |
5% | 46.0% |
7% | 58.1% |
This distinction is important when comparing churn data from different sources. Some SaaS companies report monthly customer churn, others report annual logo churn, and others use revenue-based churn measures. A churn rate without a time period and metric definition is therefore difficult to benchmark meaningfully.
B2B SaaS churn rate by customer segment
B2B SaaS churn also changes considerably depending on whether a company sells primarily to small businesses, mid-market customers, or enterprises. Higher-value customers tend to churn less because SaaS products often become more deeply embedded in their workflows, contracts are longer, and switching providers requires more effort.
Paddle cites an estimated 3–7% monthly user churn for SMB customers, compared with roughly 0.5–1% for enterprise customers. This helps explain why two healthy SaaS companies can report very different churn rates even when both are performing well within their respective markets.
Billing frequency matters too. ChartMogul found that among SaaS companies with ARPA below $25, median customer retention was 62% for annual plans versus 41% for monthly plans. The gap shrinks as ARPA increases, but annual billing still shows stronger retention.
So when evaluating B2B SaaS churn rate benchmarks, compare like with like. A low-cost SaaS product serving thousands of small businesses should not automatically be judged against an enterprise SaaS company selling annual contracts to a few hundred large organizations.
What is SaaS churn rate?
SaaS churn rate measures the percentage of customers or recurring revenue that a company loses during a specific period. It is a core churn metric for a subscription business because SaaS growth depends not only on acquiring new customers but also on retaining the customers and revenue already acquired.
For example, if a SaaS company begins a month with 1,000 customers and 40 cancel during that month, its monthly customer churn rate is 4%. If those customers represent a disproportionately large or small share of MRR, however, the company's revenue churn rate will be different.
This is why “churn” should never be treated as a single SaaS metric. Customer churn and revenue churn answer related but different questions.
Customer churn rate vs. revenue churn rate
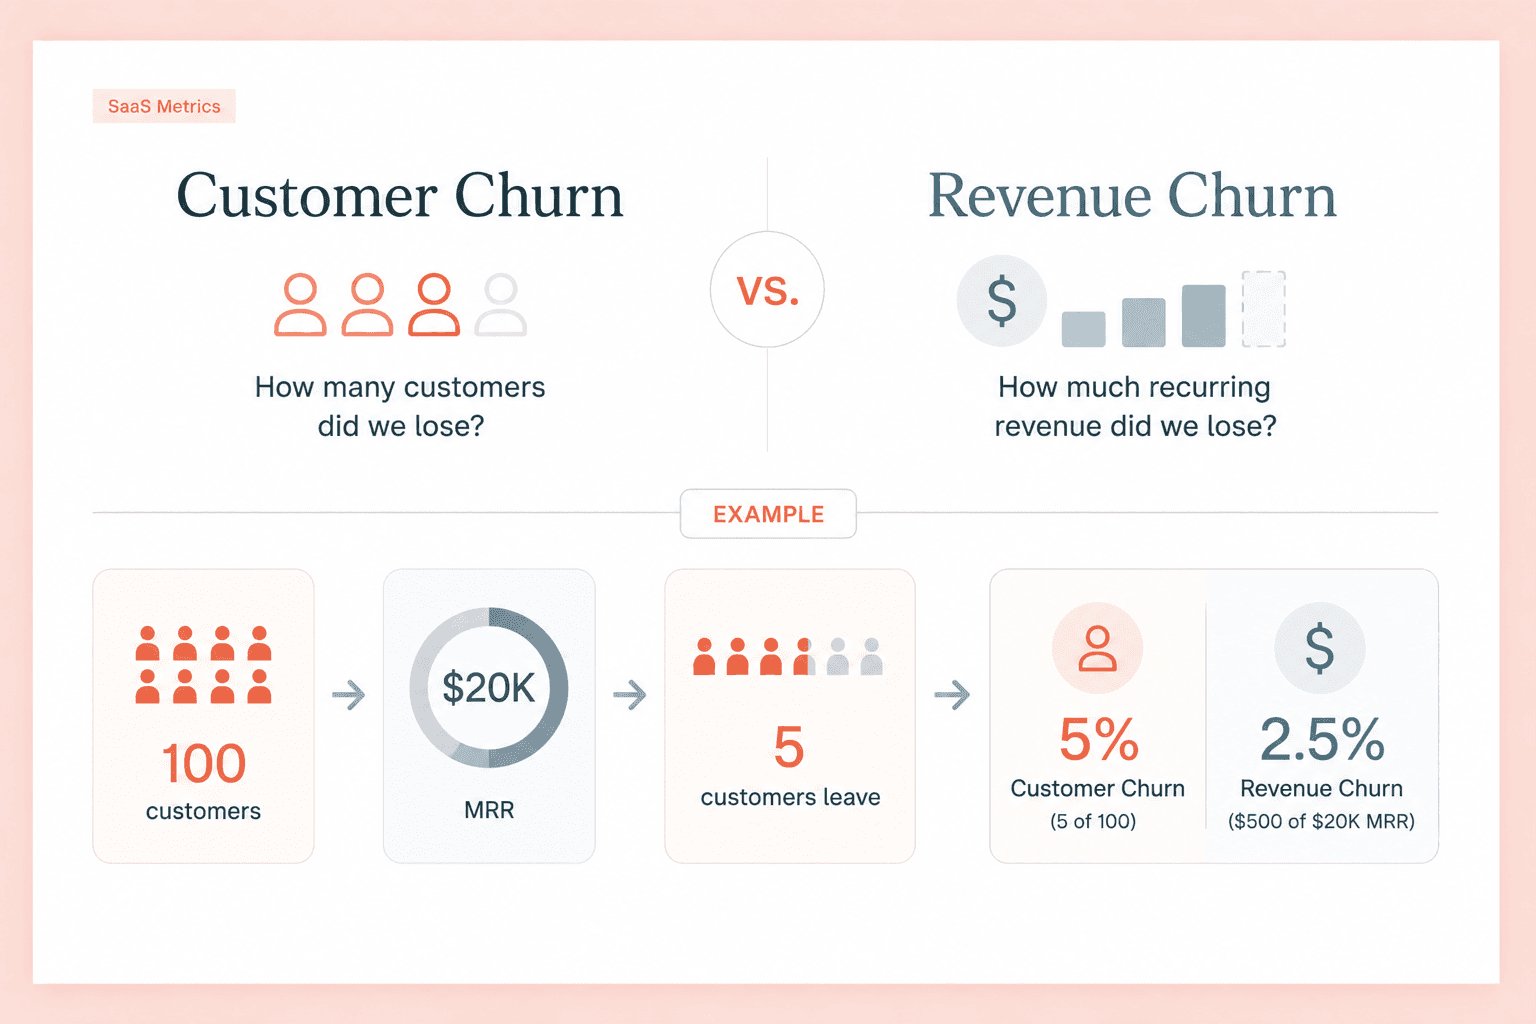
Customer churn rate, sometimes called logo churn, tracks the percentage of customers who leave during a given period. It tells you how successfully the SaaS product retains accounts.
Revenue churn rate tracks recurring revenue lost through cancellations and, depending on the metric used, downgrades. This provides a financial view of churn rather than simply counting lost customers.
Consider a SaaS company with 100 customers and $20,000 in MRR. If five customers cancel, customer churn is 5%. But if those five customers generated only $500 in MRR, the revenue lost represents just 2.5% of starting MRR.
The reverse can also happen. Losing one large enterprise account may produce low customer churn but high revenue churn. For B2B SaaS companies with large differences in contract value, tracking customer churn and revenue churn together provides a much clearer picture than either churn measure alone.
Gross revenue churn vs. net revenue churn
Gross revenue churn measures recurring revenue lost from the existing customer base through cancellations and downgrades, without allowing expansion revenue to offset those losses.
Net revenue churn goes one step further by accounting for expansion from existing customers, such as upgrades, additional seats, or increased usage. When expansion revenue exceeds revenue lost through churn and contraction, net revenue churn becomes negative.
For example, suppose a SaaS business starts the month with $100,000 in MRR. It loses $4,000 from cancellations and downgrades but generates $6,000 in expansion MRR from existing customers. Gross revenue churn is 4%, while net revenue churn is -2%.
Negative churn is particularly powerful because the existing customer base produces more recurring revenue over time even before new customers are added. ChartMogul reports that 40% of SaaS businesses in the $15–30M ARR range have negative churn, showing how expansion can become increasingly important as SaaS companies scale.
Churn metrics every SaaS business should track
You don't need to track every possible variation of churn. For most SaaS companies, a small set of churn metrics provides enough information to understand customer retention and its impact on recurring revenue:
Customer churn rate: the percentage of customers lost during the period.
Gross revenue churn: the percentage of recurring revenue lost through cancellations and contractions.
Net revenue churn: revenue churn after accounting for expansion from existing customers.
Gross revenue retention (GRR): the percentage of recurring revenue retained before expansion.
Net revenue retention (NRR): the percentage of recurring revenue retained after including expansion.
These metrics become more useful when segmented by customer type, pricing plan, acquisition channel, or product. Benchmarkit's 2025 B2B SaaS study, for example, reported median gross revenue retention of 88%, down from 90% several years earlier, and specifically recommends analyzing GRR by customer segment and product.
A SaaS business may therefore have an acceptable company-wide churn rate while hiding a serious churn problem within a particular customer cohort. Segment-level churn analysis can reveal those differences.
What is a good churn rate for SaaS?
A good churn rate for SaaS is low relative to companies with a similar customer profile, pricing model, and stage of development, and it improves as the business matures. No universal threshold separates healthy SaaS companies from unhealthy ones.
As a rough benchmark, monthly customer churn below 3% is generally strong, while rates around 5% or higher deserve closer attention for an established B2B SaaS company. But context matters. A low-priced B2C SaaS product may experience substantially higher churn and still have viable unit economics, while 3% monthly churn could be uncomfortably high for enterprise SaaS.
The best benchmark is therefore a combination of external SaaS churn benchmarks and the company's own historical performance.
Good churn rate for SMB SaaS companies
SMB SaaS usually experiences higher churn because small customers have lower switching costs, shorter buying cycles, and are more likely to use monthly subscriptions. Some customers may also go out of business, change priorities, or cancel tools quickly when budgets tighten.
A monthly customer churn rate in the 3–7% range is therefore not unusual for SMB-focused SaaS. However, being within an industry range does not necessarily make higher churn desirable. A SaaS company should still look for opportunities to lower churn through better customer targeting, onboarding, product adoption, and retention.
For an SMB SaaS business already near the lower end of that range, further improvements can have a significant compounding effect on customer lifetime value.
Good churn rate for mid-market SaaS companies
Mid-market SaaS generally sits between self-service SMB products and enterprise software. Customers tend to have larger contracts, more stakeholders involved in the buying process, and greater switching costs, all of which can contribute to lower churn.
Rather than using a single percentage to define good churn, mid-market SaaS companies should compare retention across customer cohorts and ARPA bands. ChartMogul's data shows a clear relationship between higher ARPA and lower customer churn: median monthly customer churn falls from 4.2% at $25–$100 ARPA to 3.1% at $100–$250 and 2.2% at $500–$1,000.
If churn remains high as contract values increase, that can indicate a deeper problem with product fit, onboarding, customer success, or the expectations established during the sales process.
Good churn rate for enterprise SaaS companies
Enterprise SaaS should generally experience the lowest customer churn. Contracts tend to be larger and longer, implementation can require significant effort, and products often become integrated into important business processes.
Paddle's cited benchmark of roughly 0.5–1% monthly user churn for enterprise customers provides a useful reference point. Established SaaS companies with higher-value customers should therefore expect materially lower churn than early-stage or SMB-focused products.
For enterprise SaaS, however, customer churn rate alone can be misleading. Losing only a few customers may represent a substantial amount of ARR, so revenue churn, gross revenue retention, and net revenue retention become particularly important. A healthy SaaS company should aim not only for low customer churn but also for strong retention and expansion within the accounts that remain.
How to calculate churn rate in SaaS
Calculating churn rate is straightforward once you decide what you want to measure. The main distinction is between customer churn, which measures lost customers, and revenue churn, which measures lost recurring revenue.
The measurement period also matters. SaaS companies commonly calculate churn monthly, but businesses with annual contracts may also track quarterly or annual churn. Whatever period you choose, use the same methodology consistently so that changes in the metric reflect changes in customer behavior rather than changes in how churn is calculated.
How to calculate customer churn
Customer churn tracks how many customers leave during a given period relative to the number of customers you had at the beginning of that period.
The formula is:
Customer churn rate = Customers lost during the period ÷ Customers at the start of the period × 100
Suppose a SaaS company starts the month with 500 customers and 20 cancel before the end of the month. Its monthly customer churn rate is:
20 ÷ 500 × 100 = 4%
New customers acquired during the month are not added to the starting customer count for this calculation. The goal is to measure what happened to the cohort of customers that existed at the start of the period.
For more useful churn analysis, SaaS companies can calculate the same metric separately for different plans, customer segments, or acquisition channels. A company-wide customer churn rate of 4%, for example, could hide a 2% churn rate among annual subscribers and an 8% rate among monthly subscribers.
How to calculate revenue churn
Revenue churn measures how much recurring revenue a SaaS business loses from its existing customer base. It can capture both customers who cancel completely and customers who downgrade their subscriptions.
A basic gross revenue churn formula is:
Gross revenue churn rate = MRR lost from cancellations and downgrades ÷ MRR at the start of the period × 100
For example, imagine a SaaS company starts the month with $100,000 in MRR. During the month, it loses $3,000 from cancellations and another $1,000 from downgrades.
$4,000 ÷ $100,000 × 100 = 4% gross revenue churn
Net revenue churn also includes expansion revenue from existing customers:
Net revenue churn rate = (Churned MRR + contraction MRR − expansion MRR) ÷ starting MRR × 100
If the same company generated $6,000 in expansion MRR, its net churn would be:
($3,000 + $1,000 − $6,000) ÷ $100,000 × 100 = -2%
In this case, the company has negative churn. Existing customers generate more additional recurring revenue than the business loses through cancellations and downgrades.
Customer churn and revenue churn should usually be tracked together. If customer churn rises while revenue churn remains low, smaller customers may be leaving disproportionately. If revenue churn increases faster than customer churn, the company may be losing higher-value accounts.
Why churn rates vary between SaaS companies
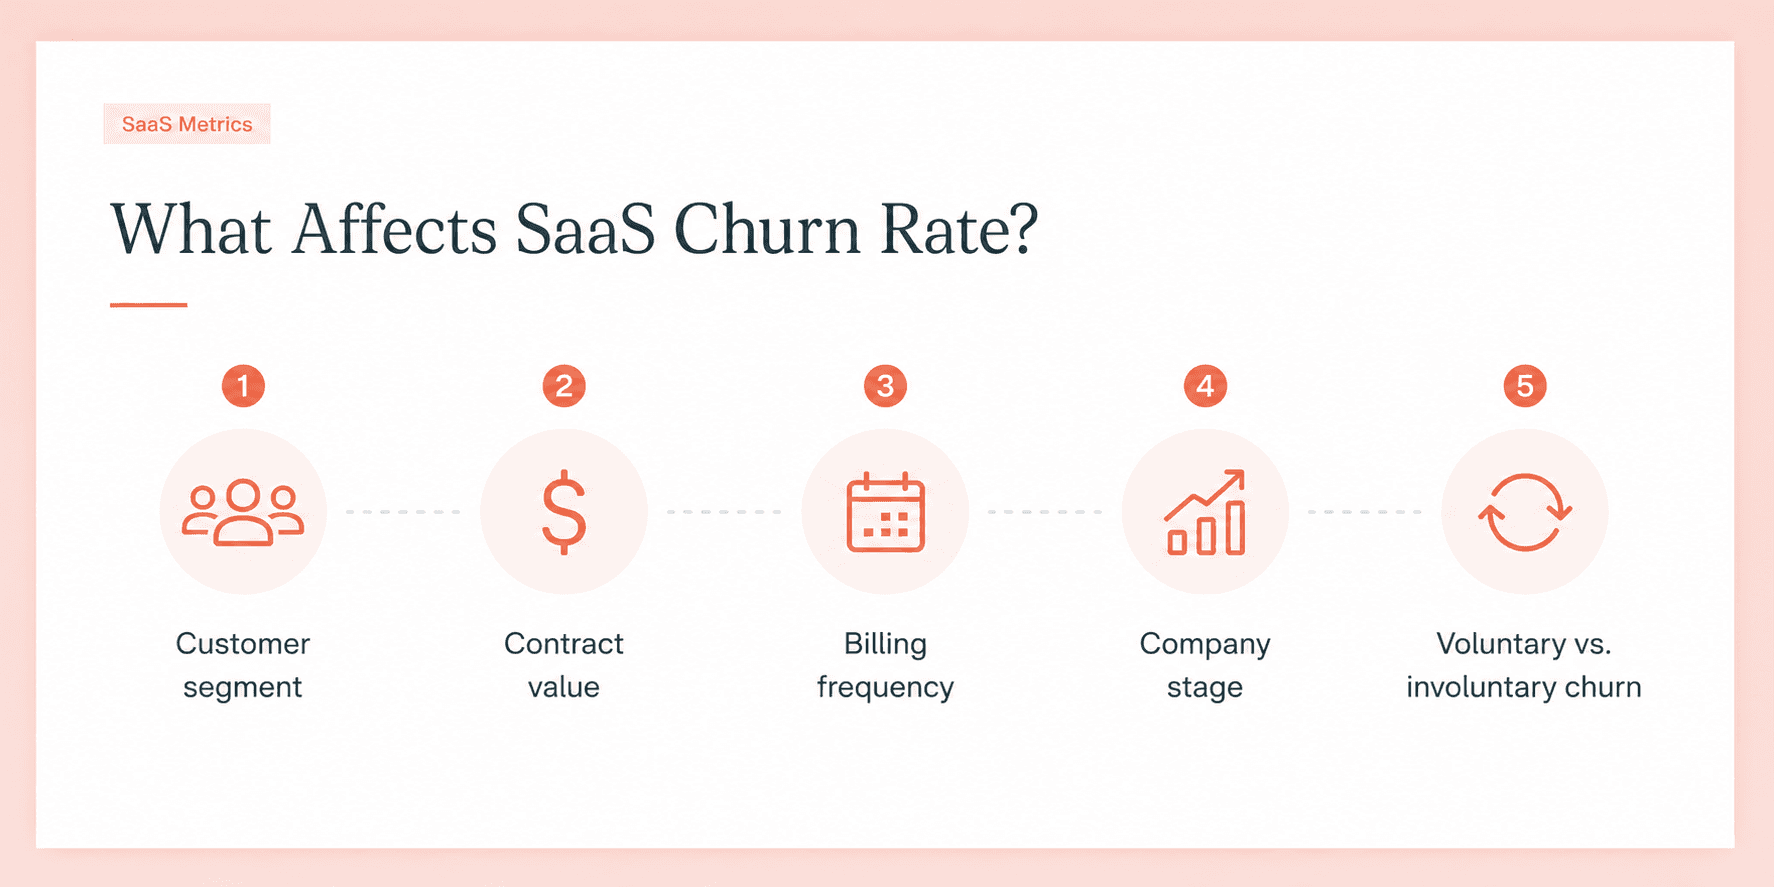
Churn rates can differ dramatically between two otherwise successful SaaS companies. A 5% monthly churn rate might be sustainable for a low-cost self-service product but represent high churn for a B2B SaaS company selling expensive annual contracts.
These differences are one reason SaaS churn benchmarks should be treated as reference points rather than universal targets. Customer type, pricing, billing frequency, product maturity, and the reasons customers leave all affect the churn rate a company can reasonably expect.
B2B SaaS vs. B2C SaaS churn
B2B SaaS generally experiences lower churn than B2C SaaS because business software is often more deeply integrated into customer workflows. Teams may need to migrate data, retrain employees, rebuild integrations, or obtain internal approval before switching to another SaaS provider.
B2C SaaS customers usually face fewer switching costs. A consumer can often cancel a subscription within minutes, particularly when the product is discretionary rather than essential. This makes B2C SaaS more vulnerable to changes in individual budgets, preferences, and usage patterns.
Even within B2B SaaS, however, the range is wide. SaaS providers serving freelancers and very small businesses may experience churn patterns closer to consumer subscriptions, while enterprise SaaS products can retain the same accounts for many years.
Customer type and average contract value
Average contract value is one of the strongest contextual factors when comparing churn rates. ChartMogul's benchmarks show that customer churn generally falls as ARPA increases, with median monthly churn declining from 6.1% for companies below $25 ARPA to 1.8% for companies above $1,000 ARPA.
Part of this relationship comes from the nature of the customer. Higher-value accounts often have clearer buying processes, more employees using the product, dedicated customer success support, and greater operational dependence on the software.
That does not mean increasing prices will automatically reduce churn. Rather, SaaS companies selling higher-value products tend to operate in environments where customers have stronger commitments and higher switching costs.
This is also why comparing churn rates across SaaS businesses without considering customer value can be misleading. A $15-per-month productivity tool and a $50,000-per-year B2B platform may both be SaaS products, but their expected churn rates should differ significantly.
Monthly vs. annual contracts
Subscription length can also substantially affect churn. Monthly subscriptions give customers a frequent opportunity to reconsider whether they still need a product, while annual contracts create a longer commitment.
ChartMogul found particularly large differences among lower-priced products. For SaaS businesses with ARPA below $25, median customer retention was 62% for annual plans compared with 41% for monthly plans.
Annual billing can therefore contribute to lower churn, but it should not be mistaken for solving the underlying causes of churn. A dissatisfied annual customer may simply wait until renewal to cancel. For this reason, SaaS companies should monitor product usage and customer engagement even when contractual churn appears low.
When comparing monthly and annual churn, it is also important to distinguish billing frequency from the period used to calculate the metric. A company can sell annual subscriptions while still measuring customer churn every month.
Product maturity and company stage
Early-stage SaaS companies often experience higher churn because they are still refining their ideal customer profile, positioning, onboarding, and core product. Some customers may sign up even though they are not a strong fit, while others may leave because the product does not yet solve enough of their problem.
As a SaaS product matures, several factors can reduce churn. The company gets better at identifying customers likely to succeed, onboarding improves, missing features are added, and customer success teams learn which behaviors indicate churn risk.
ChartMogul's data reflects this pattern at the company level. Median monthly customer churn is 6.5% for SaaS companies below $300K ARR, compared with 3.1% for those between $8M and $15M ARR.
Company size alone does not cause better retention, of course. Successful companies are more likely to reach larger ARR levels in the first place. Still, established SaaS companies generally have more mature processes for acquisition, onboarding, support, and retention than businesses still searching for repeatable product-market fit.
Voluntary vs. involuntary churn
Not every customer who churns has actively decided to stop using the product. SaaS churn can be divided into voluntary and involuntary churn, and the distinction matters because each requires different solutions.
Voluntary churn happens when a customer deliberately cancels. Common reasons include poor product fit, insufficient usage, pricing concerns, missing features, weak customer support, or switching to a competitor.
Involuntary churn occurs when the subscription ends without an intentional cancellation. Failed credit card payments, expired cards, insufficient funds, and other billing problems are common causes.
This distinction is important because involuntary churn may be preventable without changing the product itself. Payment retries, card update reminders, account updater services, and dunning workflows can recover subscriptions that would otherwise be lost.
Voluntary churn requires a different kind of analysis. SaaS companies need to understand why customers leave, which cohorts churn more, and whether they can identify churn risk before cancellation. Treating both forms of churn as the same problem makes it harder to choose the right retention strategy.
How churn affects SaaS growth
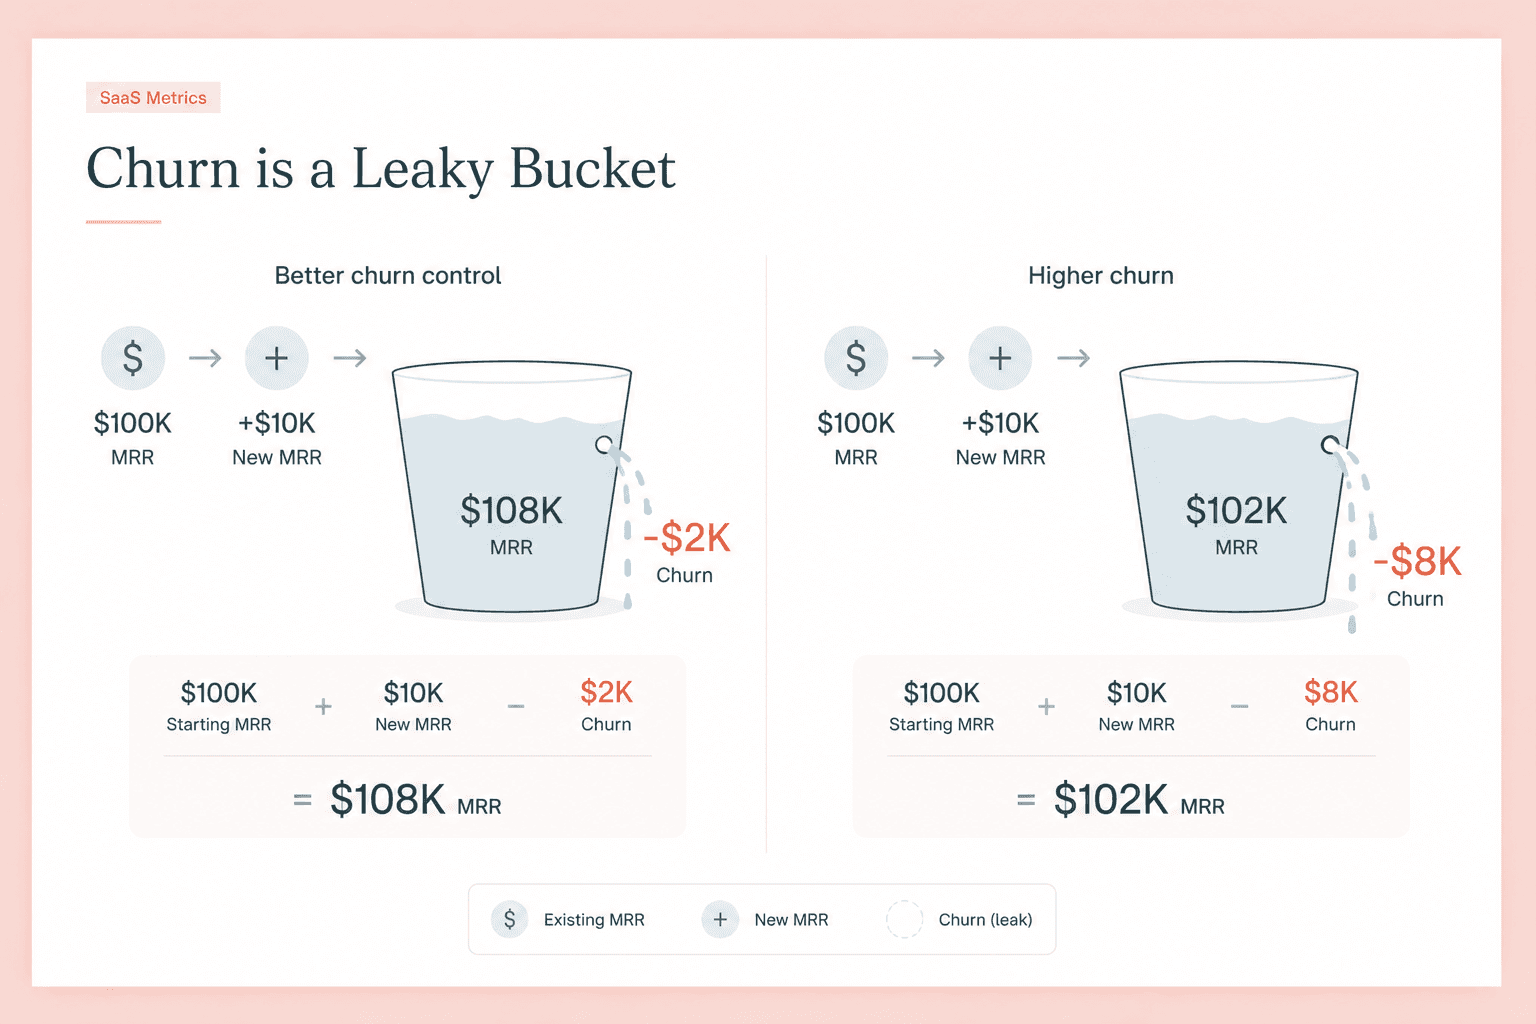
Churn is not simply a retention metric. It directly affects how much a SaaS company can grow from a given level of customer acquisition.
As a SaaS business gets larger, the absolute amount of revenue exposed to churn increases. A company with $100,000 in MRR and 5% monthly revenue churn loses $5,000 in recurring revenue each month before accounting for new sales. At $1 million in MRR, the same churn rate represents $50,000.
This creates what is sometimes called the leaky bucket problem. The company must replace an increasing amount of lost revenue just to remain at the same size. Lower churn allows more of each month's new revenue to contribute to actual growth rather than replacing customers and revenue that have disappeared.
Customer churn and customer lifetime value
Customer lifetime value is closely connected to churn because lower churn means the average customer remains subscribed for longer.
In a simplified subscription model with relatively stable monthly churn, expected customer lifetime can be approximated as:
Customer lifetime ≈ 1 ÷ monthly customer churn rate
At 5% monthly churn, this simplified calculation suggests an average customer lifetime of around 20 months. At 2% churn, it rises to roughly 50 months.
Monthly customer churn | Approximate customer lifetime |
|---|---|
1% | 100 months |
2% | 50 months |
3% | 33 months |
5% | 20 months |
7% | 14 months |
This is only a simplified model. Real SaaS customer cohorts do not necessarily churn at a constant rate, and lifetime value should also account for gross margin, expansion, contraction, and potentially different retention patterns over time.
Still, the relationship demonstrates why reducing customer churn can have such a large financial effect. Lower churn extends customer lifetime, which allows a SaaS company to generate more revenue from the acquisition cost already spent to win that customer.
Revenue churn and MRR growth
Revenue churn determines how much new MRR a SaaS company needs to add to grow.
Consider two SaaS companies that each start the month at $100,000 MRR and add $10,000 in new MRR. Company A loses 2% of its starting MRR to churn, while Company B loses 8%.
Company A | Company B | |
|---|---|---|
Starting MRR | $100,000 | $100,000 |
New MRR | +$10,000 | +$10,000 |
Revenue lost to churn | -$2,000 | -$8,000 |
Ending MRR | $108,000 | $102,000 |
Net MRR growth | 8% | 2% |
Both businesses have exactly the same acquisition performance, but Company A grows four times faster because it retains more of its existing revenue.
Expansion can change this equation further. A SaaS company with strong upsells, seat expansion, or usage-based growth can offset revenue churn from other customers. Once expansion exceeds churn and contraction, the company reaches negative net revenue churn and can grow its existing revenue base without relying entirely on new customer acquisition.
High SaaS churn rate and company valuation
High SaaS churn rate can also affect how investors and potential acquirers evaluate a SaaS business. Recurring revenue is valuable partly because it is expected to continue. If a large percentage of customers or revenue disappears each year, future cash flows become less predictable.
High churn also forces a company to spend more on acquisition simply to replace lost customers. That can weaken unit economics, reduce customer lifetime value, and make growth more dependent on maintaining a high volume of new sales.
Conversely, lower churn can make the same amount of ARR more durable. Strong gross revenue retention demonstrates that customers continue paying for the product, while strong net revenue retention shows that existing accounts can become more valuable over time.
The impact of churn is therefore broader than the churn metric itself. It influences customer lifetime value, acquisition efficiency, MRR growth, revenue predictability, and ultimately the quality of a SaaS company's recurring revenue.
How to reduce SaaS churn
Reducing churn starts with understanding why customers leave, not applying the same retention tactics to every account. Churn may result from poor customer fit, weak onboarding, low product adoption, pricing concerns, missing features, failed payments, or changes inside the customer's own business.
The first step is therefore to segment churn data and look for patterns. Compare churn rates by pricing plan, customer size, acquisition channel, subscription type, cohort, and product usage. This churn analysis can reveal whether the problem affects the entire customer base or is concentrated among particular groups.
For example, if customers acquired through one channel consistently churn at higher rates, the problem may begin before onboarding. The channel could be attracting customers whose expectations or needs do not match the SaaS product. If churn happens primarily within the first 30 days regardless of acquisition source, onboarding or activation becomes a more likely explanation.
Reducing SaaS churn is ultimately about identifying these patterns and addressing the underlying causes rather than simply trying to convince customers not to cancel.
Reduce customer churn with better onboarding
The period immediately after signup is particularly important because customers have not yet developed habits around the product. They may understand why they purchased a subscription but still need to experience its value before the product becomes part of their workflow.
Effective onboarding should therefore focus on helping customers reach a meaningful outcome, not simply teaching them where every feature is located. The specific activation event will vary by SaaS product. It could be inviting a team member, connecting a data source, publishing a first project, creating an automation, or completing another action strongly associated with long-term usage.
SaaS companies can improve onboarding by:
identifying the actions retained customers commonly complete early in their lifecycle;
removing unnecessary steps between signup and first value;
personalizing onboarding by customer use case or role;
using emails and in-product prompts when important setup steps remain incomplete;
providing higher-touch onboarding for larger B2B SaaS customers.
It is also useful to measure churn by onboarding completion. If customers who complete a particular setup step experience significantly lower churn, increasing completion of that step may have a greater impact than adding new product features.
Reduce SaaS churn through product adoption
A customer can complete onboarding and still churn months later if the product gradually stops being useful. Product adoption therefore needs to be monitored throughout the customer lifecycle.
Usage frequency alone is not always enough. A better approach is to identify the behaviors that indicate customers are receiving recurring value. For a project management SaaS product, that might be the number of active team members and completed projects. For an analytics platform, it could be connected data sources, reports viewed, or dashboards shared.
When these behaviors decline, the customer may become more likely to churn. SaaS providers can respond with contextual education, customer success outreach, feature recommendations, or other interventions appropriate to the account.
Expansion can also strengthen retention. When additional teams, users, or workflows adopt the product, switching becomes more difficult, and the product often becomes more valuable to the organization. This is one reason established SaaS companies frequently focus on both retention and expansion rather than treating them as separate goals.
Identify at-risk customers early
Waiting until a customer clicks “cancel” leaves little time to solve the problem. A more effective retention process identifies churn risk while there is still an opportunity to intervene.
Potential warning signals include declining product usage, fewer active users, incomplete onboarding, repeated support issues, failed payments, reduced feature adoption, negative feedback, or a major change in account behavior.
Not every signal should trigger the same response. A large enterprise customer whose usage suddenly drops may justify direct outreach from customer success, while a low-cost self-service customer may receive an automated email or in-app message.
SaaS companies can also combine multiple indicators into a customer health score. The purpose is not to predict every cancellation perfectly, but to prioritize accounts where intervention is most likely to make a difference.
Analyze churn risk at the cohort level. If customers from a specific pricing plan, industry, acquisition source, or signup period churn at higher rates, the company may have a systematic problem rather than a collection of unrelated cancellations.
Reduce involuntary churn
Involuntary churn deserves separate attention because these customers have not necessarily decided to leave. A failed payment can end an otherwise healthy subscription even when the customer still wants the product.
Common ways to reduce involuntary churn include payment retries, pre-dunning emails before cards expire, automatic card updates, clear failed-payment notifications, and a grace period before access is removed.
The process should make fixing a billing problem as easy as possible. A customer who needs to search through account settings, contact support, or re-enter unnecessary information has more opportunities to abandon the subscription entirely.
For SaaS businesses with a large number of monthly subscriptions, even relatively small improvements in payment recovery can lower churn without changing acquisition, pricing, or the product itself.
Use churn data to understand why customers cancel
Cancellation surveys can provide useful information, but they should not be the only source of churn data. Customers may choose the quickest survey option, provide a vague answer, or simply leave without explaining their decision.
A stronger churn analysis combines several sources of evidence:
Cancellation reasons: What customers say when they leave.
Product usage: What customers actually did before cancellation.
Customer characteristics: Which plans, industries, company sizes, and acquisition channels experience higher churn.
Support and feedback: What problems appeared before the customer left.
Cohort retention: Whether churn is improving or worsening among newer groups of customers.
This makes it easier to distinguish symptoms from causes. Customers might select “too expensive” when canceling, for example, but usage data may show that those accounts never adopted the core features. The underlying problem may be insufficient value rather than price alone.
Churn data should ultimately lead to testable hypotheses. If customers who fail to invite teammates are less likely to remain subscribed, the SaaS company can experiment with onboarding changes designed to increase team adoption and then measure whether those cohorts churn less.
SaaS churn FAQs
Is 5% churn high for SaaS?
A 5% monthly customer churn rate can be high for SaaS, particularly for an established B2B or enterprise company. However, it may fall within a normal range for an early-stage or SMB-focused SaaS business with relatively low contract values.
The compounding effect is important. At a constant 5% monthly churn rate, approximately 46% of the starting customer base would be lost over a year. A company experiencing this level of churn needs strong acquisition just to replace departing customers.
Instead of treating 5% as a universal threshold, compare the rate with SaaS churn benchmarks for companies with similar ARPA, customer segments, and contract structures.
Is 3% monthly churn rate good for SaaS?
A 3% monthly churn rate is generally a solid result for many SaaS companies, but whether it's good depends on the market. It would be relatively strong for a low-cost SMB SaaS product but could still be high for enterprise SaaS.
A 3% monthly customer churn rate compounds to approximately 31% annual churn. That illustrates why apparently low monthly percentages can still represent substantial customer turnover over longer periods.
The company's own trend also matters. Reducing churn from 5% to 3% can represent a major improvement even if competitors with different customer profiles report lower rates.
What is a good annual churn rate for SaaS?
There is no single good annual churn rate for SaaS. Enterprise products with long contracts and high switching costs should generally experience much lower annual churn than low-priced monthly subscriptions aimed at consumers or small businesses.
It is also important not to compare annual churn directly with monthly churn. Monthly churn compounds, so a 2% monthly churn rate corresponds to roughly 21.5% annual churn rather than 24%.
When evaluating annual churn rate, compare companies with similar customers, contract values, billing models, and churn definitions.
What are typical SaaS churn benchmarks?
Typical SaaS churn benchmarks vary substantially by company size and customer value. ChartMogul reports median monthly customer churn of 6.5% for SaaS companies below $300K ARR, 3.7% at $1–3M ARR, and 3.1% at $8–15M ARR.
ARPA produces a similar pattern. Median monthly customer churn ranges from 6.1% below $25 ARPA to 1.8% above $1,000 ARPA.
These benchmarks for SaaS are more useful than a single industry average because they demonstrate how expected churn changes as customer value and company scale increase.
What is the difference between churn and retention rate?
Churn measures the share of customers or revenue lost during a period, while retention measures the share that remains.
In the simplest customer-based calculation:
Customer retention rate = 100% − customer churn rate
If monthly customer churn is 4%, the corresponding customer retention rate is 96% for that month.
Revenue retention is slightly more complex because SaaS companies can generate expansion revenue from existing customers. Gross revenue retention excludes expansion, while net revenue retention includes it. As a result, net revenue retention can exceed 100% even though some customers churn.
Can a SaaS company have negative churn?
Yes. Negative churn occurs when expansion revenue from existing customers exceeds the recurring revenue lost through cancellations and downgrades.
Suppose a SaaS company loses $5,000 in MRR to churn and contraction during a month but gains $8,000 in expansion MRR from upgrades, additional seats, and increased usage. Its existing customer base has grown by $3,000 in MRR despite some customers leaving.
Negative net revenue churn is particularly valuable for B2B SaaS because it allows recurring revenue from existing customers to grow before any new sales are added. It does not mean customer churn has disappeared. Customers can still leave, but expansion from retained accounts more than compensates for the revenue lost.
For that reason, healthy SaaS businesses should look beyond one average churn rate. Customer churn, gross revenue churn, net revenue churn, retention, expansion, and cohort trends together provide a much clearer picture of whether the customer base is becoming stronger or weaker over time.